| Issue |
BIO Web Conf.
Volume 10, 2018
Contemporary Research Trends in Agricultural Engineering
|
|
|---|---|---|
| Article Number | 01006 | |
| Number of page(s) | 4 | |
| Section | Agronomy and Biophysics | |
| DOI | https://doi.org/10.1051/bioconf/20181001006 | |
| Published online | 26 March 2018 | |
The effect of seed moisture and temperature on grinding characteristics of quinoa (Chenopodium quinoa Willd.)
1
University of Al-Qasim Green, College of Food Sciences, Department of Food Technology, Babylon, Iraq
2
University of Life Sciences, Department of Thermal Technology and Food Process Engineering, Doświadczalna Str. 44, 20-280, Lublin, Poland
* Corresponding author: This email address is being protected from spambots. You need JavaScript enabled to view it.
Abstract
Quinoa (Chenopodium quinoa Willd) is a native food plant of the Andean region of South America. Quinoa seeds have remarkable nutritional properties, not only from its high protein content, but also from its good amino acid balance. The aim of the study was evaluate the influence of quinoa seed moisture content (10, 12, 14, 16 and 18%) and temperature (-20, 3, 20 and 40°C, with the initial grain moisture content of 10.5%) on grinding process. Especially the particle size distributions and grinding energy indices were determined. The results showed that the increase of seed moisture content from 10 to 16% caused an increase the specific grinding energy from 6.9 to 8.3 kJ·kg-1, beside of this as the moisture increased the average particle also increased. The highest changes were observed in the fraction of coarse particles (above 1.0 mm). Interestingly, the mass fraction of fine particles (below 0.2 mm also increased). Other grinding indices also confirmed an increase the grinding energy requirements with the increase seed moisture content. The temperature of seed has little influence on quinoa grinding process. The highest grinding energy requirements were observed when the frozen seeds were ground.
© The Authors, published by EDP Sciences, 2018
 This is an Open Access article distributed under the terms of the Creative Commons Attribution License 4.0, which permits unrestricted use, distribution, and reproduction in any medium, provided the original work is properly cited. (http://creativecommons.org/licenses/by/4.0/).
1 Introduction
Quinoa (Chenopodium quinoa Willd) have been cultivated and consumed by humans for the last 5000-7000 years. Quinoa comprise a higher nutrition value than traditional grains and it is a promising worldwide cultivar for human consumption. Quinoa seeds have been traditionally consumed as food by the native population of the Andes region. Seeds of this plant contains of many health advantages and exceptional nutritional value such as: minerals, vitamins, fatty acids, antioxidants and a high concentration of protein in addition it is also considered as an important source for dietary fiber and other bioactive compounds [1]. Due to this fact the functional properties of quinoa grains can make contribution to avoid risk of many diseases by using it as food product for humankind. There are several developments with quinoa flour at a smaller scale, like bread, cookies, muffins, pasta, snacks, drinks, flakes, breakfast cereals, baby foods, beer, diet supplements, and extrudates [2]. Besides, quinoa is gluten free and it is an important feature that explains the baker’s and brewer’s increasing interest in using quinoa for production products for celiac people [3].
Nowadays, it became necessary to look at performance of the manufacturing processes due to increasing cost of energy and raw materials. The grinding process is one of the most important process in the seed industry. Hemery et al. [4] found that finer grinding gives with more available surface area may make these compounds more bioavailable and digestible for improved health benefits. From the other hand the grinding process is very energy consuming, for example during wheat flour milling it takes from 70% to 90% energy for flour production [5]. The grinding energy requirements depends on the size reduction method and on the properties of raw materials. The moisture content of seed strongly influences on mechanical properties of seed and thus affected on the grinding process [6]. Moistening is one of the most important pretreatments before the proper technological processes. The moisture of seeds has an effected on the grinding characteristics, and it causes an increase in seed elasticity and plasticity, which leads to an increase in the energy requirements in the course of grinding [7]. Dziki and Laskowski [8] found that increasing moisture content of wheat (range12-16%) leads to increase in the specific grinding energy (from 15 to 21%), while in contrary to these results Probst et al. [9] observed that there were no significant influence the moisture contents, range of 10% to 20%, for grinding energy of corn. Also the temperature of seeds changes the mechanical properties of kernel [10] and thus influences on the grinding process [11].
To the our best knowledge, there is no study concerning the grinding characteristics of quinoa seed. The aim of our work was to evaluate the influence of quinoa moisture content and temperature on grinding energy requirements and particle size distribution.
2 Materials and methods
2.1 Sample preparation
The quinoa seeds were bought in the local supermarket. The seeds come from Argentina a and were characterized by: initial moisture content 10.5% (w.b), bulk density 735 kg·m-3, mass of 1000 seeds 4.1g, fibre content 3.62%, fat content 6.68%, protein content 16.64% and ash content 1.99%.
The seeds were tempered by adding water or by air drying at 40°C to adjust moisture content (w.b.) to 10%, 12%, 14%, 16%, and or 18%. Besides, the seed with the initial moisture content (10.5%) were stored with different temperatures (°C): -20, 3, 2 and 40°C, using climatic chamber.
2.2 Grinding process
The samples of quinoa seed were ground by using the laboratory roller mill (Sadkiewicz Instruments, Bydgoszcz Poland). The 100-g samples were weighted just prior to grinding. The mill was equipped with a computer system that allowed the recording and analyzing the grinding energy consumption. The amount of energy consumed during grinding was obtained by means of a power transducer, a data acquisition and a computer system that recorded the data measured by the transducer. The grinding energy was calculated by using special computer software. The energy required to run the mill with no load was determined and subtracted from the total energy to obtain the grinding energy. The unloaded grinder current was monitored prior to grinding and remained constant over all testing. The specific grinding energy was determined as the ratio of the grinding energy to the mass of the material taken for grinding. The sieving test was used to determine the particle size distribution of the pulverized material. Sieving was carried out for 5 min, by using a laboratory screen (Thyr 2, SASKIA, Germany), and separated into fractions using sieves of sizes, 1.60, 1.00, 0.80, 0.63, 0.400, 0.315, and 0.200 mm‥ On the basis of the particle size distribution, the average particle size (dp) was calculated [12]:
 (1)
(1)
where ϕ represents the differential weight fraction (kgkg-1) of particles passing through aperture size di (mm).
The grinding ability index (Ef) was calculated as a ratio of the grinding energy to the surface area of the pulverized material. The surface area of the pulverized material was evaluated according to the procedure described by Jha and Sharma [13]. The Sokołowski’s grinding index (Ks) was calculated on the basis of the size reduction theory described by Sokołowski [14]. Details of the procedure used in determining these indices can be found in Dziki [15]. The distribution of the particle size was evaluated thrice and the values of grinding indices were calculated from the average particle size. Based on the literature data the values of specific grinding energy obtained for quinoa seed are several times lower in comparison to the values of this parameter obtained for wheat grain with different moisture. Werechowska et al. [16] found Er values form 52 to 76 kJkg-1 depending on wheat variety and moisture content.
2.3 Statistical analysis
The analysis of basic properties of seed was performed in triplicate. The measurements of grinding energy were replicated ten times. The obtained data was further subjected to a statistical analysis and the consequent evaluations were analyzed for a variance analysis (oneway ANOVA). The statistical differences between the treatment groups were estimated through Tukey’s test‥ Statistical tests were evaluated by using the Statistica 6.0 software (StatSoft, Inc., Tulsa, USA). All the statistical tests were carried out at a significance level of α = 0.05.
3 Results and discussion
The particle size distributions of the ground quinoa are given in Table 1 and 2. The results reveal that as the seed moisture content increased the fractions of the coarse (above 1.8 mm) and fine particles (below 0.2 mm) increased ground material was characterized mostly by the significantly higher fraction (P < 0.05) of the fine particles (below 0.2 mm). However the highest changes were obtained in the class of particles between 0.4-0.63 mm (decrease with the increase of seed moisture content from 53.3% to 29.3%). The distribution of the particle size depends on the method employed for grinding and the properties of the seed [17]. When the hammer mill is used for grinding, the degree of fineness of the grain depends mainly on the size of the opening of the screen. In the case of roller mill the particle size distributions depends mainly from seed moisture and hardness [18].
The average particle size (dp) of ground quinoa was shown in Fig. 1. Generally, as the seed moisture content increased the average particle size of ground quinoa increased too. However there was no statistical differences between dp for seed with 10% and 12% of moisture content and for seed with 12% and 14% of moisture. The dp among other things, depends on the grain hardness. Soft seeds are more easy to size reduction and give during comminution different grinding pattern and lower grinding energy requirements [19]. Based on the wheat seed structure the soft grains are characterized by a lower degree of adhesion between starch granules and protein matrix and thus during grinding the higher mass fraction of fine particles is produced [20].
The specific grinding energy (Er) ranged from 6.89 kJkg-1 to 8.07 kJkg-1 (Fig. 1). The incease of seed moisture form 10% to 16% caused an increase of Er. The results of Er obtained for 18% seed moisture content were not significanlty higher from seed with 14% and 16%. Similar tendency was obserwed by Dziki [15] for wheat seedss - as the seeds moisture increased from 10 to 18% the crushing energy also inreased. When the moisture was 20% a statistically significant decrease of crushing energy was observed. Mabille et al. [21] found that water affected both mechnical properties bran and endosperm properties. They found a reduction in stress to fracture in Young’s modulus, with an increase in moisture content.
The Fig. 3. presents the results of grinding ability index (Ef) and Fig. 4. shows the Sokołowski’s grinding index (Es). These indices besides grinding energy take into account the effect of grinding expressed by increase of the seeds surface after grinding and the degree of fineness, respectively. These indices clearly show that moisture of seed caused an increase the grinding energy requirements. Ef changed with the increase quinoa moisture content from 0.644 kJ·m2 to 0.946 kJ·m2, where asEs ranged from 16.9 kJ·kg-1·mm0.5 to 33.1 16.9 kJ·kg-1·mm0.5. Seed temperature had little influence on the values of these indices. The highest values both Ef and Es were found for the seed stored at the lowest temperature (-20°C) (Tab. 3). The values of these indices obtained for different kind of wheat are several times higher [15]. This indicated that quinoa seed required low grinding energy requirements in comparison to whet grain.
T – seed temperature, dp – average particle size, Er –specific grinding energy, Ef – grinding ability index, Es – Sokolowski`s grinding index
Romański et al. [22] found relationship between grain temperature and wheat compression energy requirements. As the grain temperature decreased from 40 to -20°C energy requirements increased about 12%. However, Dziki [23] showed that grain temperature (range 0-40oC) has no significant influence on the specific grinding energy of wheat grain, but has an influenced on particle size distribution of the ground material.
The influence of seed moisture content on particle size distribution of ground quinoa (%).
The influence of seed temperature on particle size distribution of ground quinoa (%).
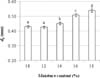 |
Fig. 1 Average particle size of ground of quinoa seed related to moisture content. |
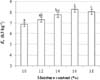 |
Fig. 2 Specific grinding energy of quinoa seed related to moisture content. |
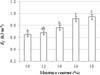 |
Fig. 3 Grinding ability index of quinoa seed related to moisture content. |
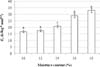 |
Fig. 4 Sokołowski’s grinding index of quinoa seed related to moisture content, |
Influence of different seed temperature on average particle size and grinding energy indices
3 Conclusions
The effect of seed moisture content and temperature on the grinding behaviour of quinoa has been investigated. The increase of the seed moisture prior to roller mill grinding has a significant influence on the grinding process, both on specific grinding energy and particle size distribution of the ground material. The increase of seed moisture from 10 to 16% increases the specific grinding energy and particle size of ground material. Most importantly, the increase of seed moisture content up to 18% caused a decrease of specific grinding energy. The temperature of seed, from -20°C to 40°C (grain moisture content 10.5%) had no significant influence on the specific grinding energy and had little influence on the particle size distribution.
References
- A. Vega-Gálvez, M. Miranda, J. Vergara, E. Uribe, L. Puente, E.A. Martínez. J. Sci. Food. Agric. 90, 15 (2010) [Google Scholar]
- R.A. Carciochi, L. Galván-D’Alessandro, P. Vandendriessche, S. Chollet. Plant Foods Hum. Nutr. 71, 4 (2016) [CrossRef] [Google Scholar]
- A. Fardet. J. Cereal Sci. 60, 3 (2014) [CrossRef] [Google Scholar]
- Y. Hemery, M. Chaurand, U. Holopainen, A.M. Lampi, P. Lehtinen, V. Piironen, A. Sadoudi, X. Rouau. J. Cereal Sci. 53, 1 (2011) [CrossRef] [Google Scholar]
- D. Dziki, & J. Laskowski, TEKA Kom. Mot. Energ. Roln, 6A, 45-52 (2006). [Google Scholar]
- D. Dziki. Powder Technol. 185, 2 (2008). [Google Scholar]
- F. Mabille, J. Grilet, J. Abecassis. Cereal Chem. 78, 3 (2001) [Google Scholar]
- D. Dziki, & J. Laskowski, TEKA Kom. Mot. Energ. Roln, 5, 56-64. (2005). [Google Scholar]
- K.V. Probst, R.K. Ambrose, R.L. Pinto, R. Bali, P. Krishnakumar, K E. Ileleji. Trans ASABE, 56, 1025-1033, (2013) [Google Scholar]
- B.M. Ghodki, T.K. Goswami. J. Food Eng. 40, 1 (2017) [Google Scholar]
- K.K. Singh, T.K. Goswami. J. Food Eng. 22, 3 (1999) [Google Scholar]
- V. Velu, A. Nagender, P.G. Prabhakara Rao, D.G., Rao. J. Food Eng. 74, 1 (2006) [CrossRef] [Google Scholar]
- S.N. Jha, R.S. Sharma. J. Food Sci. Technol. 47, 5, (2010) [Google Scholar]
- M. Sokołowski, Récents Progress en Génie Procédés 10, 221–226 (1996). [Google Scholar]
- D.Dziki. J. Food Eng. 104, 4 (2011) [CrossRef] [Google Scholar]
- M. Warechowska, A. Markowska, A.,J. Warechowski, A. Miś, A. Nawrocka, A. J. Cereal Sci. 69, 306-312, (2016) [CrossRef] [Google Scholar]
- D. Dziki., J. Laskowski. J. Food Eng. 96, 4 (2010) [CrossRef] [Google Scholar]
- V., Greffeuille, J. Abecassis, N. Barouh, V. Villeneuve, F. Mabille, C. Bar L’Helgouac'h, V. Lullien-Pellerina, V. J. Cereal Sci. 45, 1 (2006) [Google Scholar]
- D. Dziki, G.C. Pietrzak, A. Miś, K.Jończyk, U.G. Dziki. J Food Sci Technol. 51, 10 (2014). [CrossRef] [Google Scholar]
- Y. Haddad, F. Mabille, A. Mermet, J. Abecassis, J.C. Benet. Powder Technol. 105, 1-3 (1999). [CrossRef] [Google Scholar]
- F. Mabille, J. Grilet, J. Abecassis. Cereal Chem. 78, 3 (2001) [Google Scholar]
- L. Romański, R. Stopa, A. Niemiec, A. Wiercioch. Inż. Roln. 7, 7 (2003) [Google Scholar]
- D. Dziki. Inż. Roln. 9, 51 (2003) [Google Scholar]
All Tables
The influence of seed moisture content on particle size distribution of ground quinoa (%).
The influence of seed temperature on particle size distribution of ground quinoa (%).
Influence of different seed temperature on average particle size and grinding energy indices
All Figures
|
Fig. 1 Average particle size of ground of quinoa seed related to moisture content. |
| In the text | |
|
Fig. 2 Specific grinding energy of quinoa seed related to moisture content. |
| In the text | |
|
Fig. 3 Grinding ability index of quinoa seed related to moisture content. |
| In the text | |
|
Fig. 4 Sokołowski’s grinding index of quinoa seed related to moisture content, |
| In the text | |
Current usage metrics show cumulative count of Article Views (full-text article views including HTML views, PDF and ePub downloads, according to the available data) and Abstracts Views on Vision4Press platform.
Data correspond to usage on the plateform after 2015. The current usage metrics is available 48-96 hours after online publication and is updated daily on week days.
Initial download of the metrics may take a while.