| Issue |
BIO Web Conf.
Volume 26, 2020
First International Scientific-Practical Conference “Actual Issues of Physical Education and Innovation in Sports” (PES 2020)
|
|
|---|---|---|
| Article Number | 00037 | |
| Number of page(s) | 6 | |
| DOI | https://doi.org/10.1051/bioconf/20202600037 | |
| Published online | 06 November 2020 | |
An innovative technology of an athlete’s organism functional reserves increase based on bioacoustical stimulation of the respiratory system
Russian State Research Center Burnasyan Federal Medical Biophysical Center of Federal Medical Biological Agency, 123098, Moscow, Russia
* Corresponding author: s.p.dragan@rambler.ru
In order to increase an athlete’s organism functional reserves we created the innovative technology based on low-frequency vibrations influence on respiratory system. First we measured acoustic impedance of an athlete’s organism for three phases of respiration at polyharmonic acoustic signal within the range of frequency from 3 Hz to 51 Hz. After that during 2 weeks we organized six sessions of bioacoustical stimulation among the group of 20 athletes, divided into subgroups with an effective (130 dB) and placebo (60 dB) effect. It was stated that six-fold effect of a scanning tonal signal with the level of sound pressure 130 dB within the range 22-36 Hz led to resonance frequency of respiratory system increase, respiratory system sound vibrations imbibitio coefficient decrease and its resistance to sound wave increase because of reserve alveoli opening and the increase of area of cross section of alveolar ways and respiratory bronchial tubes.
© The Authors, published by EDP Sciences, 2020
 This is an Open Access article distributed under the terms of the Creative Commons Attribution License 4.0, which permits unrestricted use, distribution, and reproduction in any medium, provided the original work is properly cited.
1 Introduction
One of the urgent directions of sports medicine nowadays is an athlete’s organism functional reserves increase on the basis of non-medicated (non-drug) technologies [1-6]. Such technologies include the technologies based on the influence of low-frequency vibrations on a person’s respiratory system [7-10]. Experimental works results analysis helps to suppose that respiratory system stimulation by low-frequency acoustic vibrations can lead to lung capacity increase, gaseous metabolism improvement and to endurance and working capacity increase [11-15].
The reactions of respiratory system to low-frequency acoustic effects change depending on their frequency and intensity and depend on a person’s anthropometric characteristics [16-19]. Respiratory reactions include chest and diaphragm vibration with the main frequency of the influence, the depth and rhythm of respiration change, chest excursion cessation without gaseous metabolism in lungs violation. The last effect, in particular, is practically used in traumatology, when the patient is connected to artificial respirating unit, which works with the frequency (individual for each patient) providing full lungs ventilation without chest excursion, which helps to stop pain syndrome in case of injuries or ribs fracture [20, 21]. The aim of the research was theoretical-experimental substantiation of the technology of organism functional reserves increase on the basis of bioacoustical stimulation of respiratory system.
2 Materials and Methods
The method of bioacoustical stimulation of respiratory system is based on the effect of reserve alveoli opening and the area of cross section of alveolar ways and respiratory bronchial tubes increase, lung capacity increase [12, 15]. In terms of high-intensity sounds of low-frequency influence at resonance low-frequency, where the resistance is minimal, pressure is in a decreasing wave with some decrease transfers according to air canals to the whole depth of air cavity. In terms of pressure increase in alveoli there is gradient increase between pleural cavity and lungs. In pleural cavity the pressure is 3…4 mm Hg lower than in lungs, which corresponds with 400÷533 Pa. Negative pressure in pleural cavity is supported during the whole breath. In terms of the decreasing wave at the entrance of a respiratory channel 130 dB (63,2 Pa) gradient pressure change between lungs and pleural cavity was ≈ 10 %. In this case we can expect proportional lung capacity increase.
For technical realization of the method we created hardware-software complex of respiratory system bioacoustical stimulation [7, 10, 12, 14, 18]. Acoustic impedance measurement helps to define individual resonance frequencies and the coefficients of sound absorption in a wide range of frequencies. Bioacoustical stimulation was realized by a scanning signal within the range of the frequencies 22-36 Hz on the level 3 dB from maximal value of absorption coefficient [7, 8, 12, 15]. At the phase of the inhalation frequency decreased and at the phase of exhalation increased. The rhythm of an athlete’s respiration is synchronize with the speed of scanning and is 2-4 seconds.
The methodology of measurement was in the following procedures fulfillment. During the measurements at a full inhalation the tester takes the mouthpiece into the mouth and controls lips position in order to let them be very close to the mouthpiece and provide connection tightness, the tongue should be under the mouthpiece in order to cover exit area of the mouthpiece. An athlete makes a gradual full inhalation, controlling the state chest and voice muscles in order to provide the access of sound signal into the windpipe. After a full inhalation the breath is held for 15 seconds, during which measurement is provided. Then the procedure of measurement with breath holding within 15 seconds after a deep gradual exhalation is repeated. At the same time the state of chest and voice muscles is controlled in order to provide the access of sound signal into the windpipe.
Then an athlete takes a breath with the nose in a calm regimen of a shallow breathing. The duration of the procedure was also 15 seconds. At the end of the procedure all information was registered and saved in a form of a file in the database. Most indicesacoustic characteristics of a respiratory channel include 6 indices [7, 8, 12, 15, 22-25, 26]:
resonance frequency – f0 (is defined according to diagram crossing of the line reactance Y=0);
absorption coefficient at the frequency f0 – α(f0);
resistance at the frequency f0 – R(f0);
frequency of the maximum of absorption coefficient – f(αmax);
maximal absorption– αmax;
resistance at the frequency of maximum of absorption coefficient R(αmax).
3 Results and Discussion
With the help of the created hardware and software complex of respiratory system bioacoustical stimulation we measured the acoustic impedance. The measurements were realized at a polyharmonic acoustic signal within the range of frequency from 3 Hz to 51 Hz with the step 3 Hz during all three phases of respiration: full inhalation with breath holding, deep exhalation with breath holding and free nose shallow breathing without breath holding.
After resonance frequencies of a respiratory channel determination we organized 6 sessions of bioacoustical stimulation during two weeks in the group of 20 respondents, including false influence. 20 male athletes (age range 24,3±0,8 years old), who go in for skiing (cross-country skiing, biathlon, skiing-rollers) took part in the research. All respondents corresponded with the following criteria:
sports category not lower than the first adult category;
the absence of medical contraindications to take part in clinical trials;
people, who had written informed agreement to take part in clinical trials and the agreement for all restrictions during these trials.
There were two masters of sport, 4 candidate masters of sport and 14 people had the first category.
The average value of height and weight in the group of influence and control was the following: 175,80±2,47 cm; 185,6±1,79 cm; 75,58±3,89 kg; 76,47±1,35 kg.
Each session included three 3-minute influences. There were breaks between each influence (1 minute). The whole duration of the procedure within one session was 11 minutes. Sessions of bioacoustical stimulation were held every other day. In the group of influence the level of acoustic pressure (LAP) was 130 dB, in the control group (in the group of false influence) LAP was 60 dB, which is below the threshold of audibility.
The results of measuring acoustic indices of respiratory channel among the respondents from the control group and the group of influence were compared. Picture 1 shows all results of measuring resonance frequencies during the phases of inhalation, exhalation and in case of free breathing of both groups of testers.
With the help of χ2 criterion it is shown that the law of all 6 registered indices distribution corresponds with normal distribution. That is why the check for statistical validity of the differences between the registered indices for different phases of respiration in the groups of control and influence was realized with the help of Student t-test.
In the groups of influence and control we didn’t see statistically valid difference between the average values of the Corresponding indices in different phases of regimen (in terms of the significance level p=0,05) it proves that the experimental results can be combined.
The results of the acoustic indices statistical comparison values among the testers prove that in the group of bioacoustical stimulation influence they changed in comparison with the control group.
Six-fold influence with the help of the scanning tone signal with the level of acoustic pressure 130 dB within the range of frequencies 22-36 Hz led to the following changes in acoustic indices of the respiratory channel among testers-volunteers: resonance frequency increased; absorption coefficient decreased; sound wave resistance increased.
As acoustic indices of respiratory channel we used frequency-dependent components of impedance, it means a complex acoustic resistance. Impedance is equal to the ratio of sound pressure and vibrational speed of particles of environment (air) taking into account phase relations between them. An active component of impedance increase, sound wave resistance in a respiratory channel happens in terms of the particles vibrational speed volume decrease and the amplitude of sound pressure preservation. Vibrational speed in a respiratory channel decreases in terms of cross section area of all air-bearing ways increase. All mentioned above helps to suppose that as a result of the influence there was reserve alveoli opening and the cross section area of alveolar ways and respiratory bronchial tubes increase (17-22 order of branching).
Six indices analysis among the testers from the both groups in dynamics of a sixfold real and false influence proves that their values for the control group of testers almost didn’t change at all phases of observation. At the same time the same indices in the group of influence have considerable difference from baseline values. After the first session (during the second session) the average values of all indices changed. Maximal differences between the control group and the group of influence were registered during the 2, 3 and the 4th period of observation (before the 2, 3, and the 4th sessions of stimulation). By the 5th and the 6th session the values of acoustic indices in both groups become closer.
It proves that the following influences (3-6) are not rational. We held statistical analysis of respiratory system acoustic indices change in dynamics of observations. We compared the results of the 1st day with the 2nd, 3rd, …6th days; then the results of the 2nd day with the results of the 3rd,….6th days and etc. At the same time, as a background influence we used the combined results of the control group and the group of influence. As a result of the analysis we defined that during the second study (after the first influence) the frequency increase from 23,6 till 27,4 Hz, resistance increased from 4,2 to 6,0, and the coefficient of absorption decreased from 0,62 to 0,53. These changes turned out to be statistically valid (in terms of significance level p=0,05).
Background values comparison (the first observation of the combined group) with the values, registered during further periods in the group of influence has the same tendency: frequency and resistance are increased and the coefficient of absorption decreased. These changes also turned out statistically valid.
Acoustic indices of respiratory channel comparison among the testers of the influence group during the 2nd study and further ones didn’t reveal statistically valid changes. In order to achieve a short-term effect, for example during competitive period, two procedures can be used.
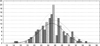 |
Picture. 1. Histogram of resonance frequency distribution in the group of influence and control for different phases of respiration (according to abscise axisresonance frequency f0, according to axis of ordinatesthe amount of observations; diagonal ruling from left to right, upwardthe regimen of inhalation, diagonal ruling right to left, upwardregimen of exhalation, horizontal hatchingregimen of free respiration; solid line of density of probability corresponds with inhalation, dotted line corresponds with the exhalation, dotted linefree respiration). |
4 Conclusions
Thus, six-fold bioacoustics influence of a scanning tonal signal use with the level of sound pressure 130 dB within the range 22-36 Hz led to the following changes of acoustic indices of a respiratory channel among the volunteers: resonance frequency increased; coefficient of absorption decreased; resistance increased. It can prove that as a result of the influence there were reserve alveoli opening and the cross section area of all air-bearing ways increase (17-22 order of branching). In order to achieve a short-term effect, instead of 6 procedures of bioacoustics stimulation two procedures can be used. Respiratory system stimulation with the help of low-frequency acoustic vibrations can be useful for functional reserves of athletes’ respiratory system increase during competitive period.
Acknowledgements
The research work was held in terms of the President of the Russian Federation grant of supporting the leading scientific schools of the Russian Federation (NSh-2553.2020.8).
References
- I.B. Ushakov, A.V. Bogomolov Vestn Ross Akad Med Nauk, 5-6, 124–128 (2014). Doi: 10.15690/vramn.v69i5-6.1056 [Google Scholar]
- A. Rao, E. Huynh, T.J. Royston, A. Kornblith, S. Roy, IEEE Rev Biomed Eng, 12, 221-239 (2019). Doi: 10.1109/RBME.2018.2874353 [CrossRef] [PubMed] [Google Scholar]
- Zh.A. Donina, I.N. Lavrova, V.M. Baranov, Bull Exp Biol Med., 155(3), 298–301 (2013). Doi: 10.1007/s10517-013-2137-x [CrossRef] [PubMed] [Google Scholar]
- M.A. Opondo, S. Sarma, B.D. Levine, Clin Sports Med., 34(3), 391–404 (2015). Doi: 10.1016/j.csm.2015.03.004 [CrossRef] [PubMed] [Google Scholar]
- E.I. Budanova, A.V. Bogomolov, Hygiene and sanitation, 95(7), 627–632 (2016). Doi: 10.18821/0016-9900-2016-95-7-627-632 [CrossRef] [Google Scholar]
- L. Aliboni, F. Pennati, T.J. Royston, J.C. Woods, A. Aliverti, PLoS One, 15(2), e0228603. (2020). Doi: 10.1371/journal.pone.0228603. [CrossRef] [PubMed] [Google Scholar]
- S.P. Dragan, A.V. Bogomolov Biomed Eng, 49, 278–282 (2016). Doi: 10.1007/s10527-016-9548-8 [Google Scholar]
- A.V. Bogomolov, S.P. Dragan, Dokl Biochem Biophys, 464, 319–321 (2015). Doi: 10.1134/S1607672915050130 [CrossRef] [PubMed] [Google Scholar]
- A.I. Dyachenko, A.O. Korotkevich, V.E. Zakharov, Phys Rev Lett., 92(13), 134501 (2004). Doi: 10.1103/PhysRevLett.92.134501 [CrossRef] [PubMed] [Google Scholar]
- S.P. Dragan, A.V. Bogomolov, A.D. Kotlyar-Shapirov, E.A. Kondrat’eva Biomed Eng, 51, 72–76 (2017). Doi: 10.1007/s10527-017-9687-6 [Google Scholar]
- L. Dimitriou, J.A. Hill, A. Jehnali, J Int Soc Sports Nutr, 12, 22 (2015). Doi: 10.1186/s12970-015-0085-8 [CrossRef] [PubMed] [Google Scholar]
- S.P. Dragan, A.V. Bogomolov Biomed Eng 50, 390–392 (2017). Doi: 10.1007/s10527-017-9662-2 [Google Scholar]
- G.R. Wodicka, K.N. Stevens, H.L. Golub, E.G. Cravalho, D.C. Shannon IEEE Trans Biomed Eng, 36(9), 925–934 (1989). Doi: 10.1109/10.35301 [Google Scholar]
- S.P. Dragan, A.V. Bogomolov, S.M. Razinkin, E.A. Kondrat’eva Biomed Eng, 53, 36–39 (2019). Doi: 10.1007/s10527-019-09873-5 [Google Scholar]
- A.V. Bogomolov, S.P. Dragan, G.G. Erofeev, Dokl Biochem Biophys, 487, 247–250 (2019). Doi: 10.1134/S160767291904001X [CrossRef] [PubMed] [Google Scholar]
- V.I. Korenbaum, I.A. Pochekutova Fiziol Cheloveka, 41(3), 127–133 (2015). [PubMed] [Google Scholar]
- S.G. Krivoshchekin, V.E. Divert, V.N. Mel’nikov, S.N. Vodianitskiĭ, L.A. Girenko, Fiziol Cheloveka, 39(1), 117–125 (2013). Doi: 10.7868/s0131164612060070 [PubMed] [Google Scholar]
- S.P. Dragan, A.V. Bogomolov, A.D. Kotlyar-Shapirov, E.A. Kondrat’eva, Reports of Biochemistry and Biophysics, 468(1), 224–225 (2016). Doi: 10.7868/S0869565216180250 [Google Scholar]
- V.V. Malaeva, V.I. Korenbaum, I.A. Pochekutova, A.E. Kostiv, S.N. Shin, V.P. Katuntsev, V.M. Baranov, Front Physiol., 9, 1255 (2018). Doi: 10.3389/fphys.2018.01255 [CrossRef] [PubMed] [Google Scholar]
- P. Harper, S.S. Kraman, H. Pasterkamp, G.R. Wodicka, IEEE Trans Biomed Eng, 48(5), 543–550 (2001). Doi: 10.1109/10.918593 [Google Scholar]
- V.I. Korenbaum, I.A. Pochekutova J Biomech., 41(1), 63–68 (2008). Doi: 10.1016/j.jbiomech.2007.07.014 [CrossRef] [PubMed] [Google Scholar]
- A.O. Iskhakova, M.D. Alekhin, A.V. Bogomolov, Information and Control Systems, 1, 15–23 (2020). Doi:10.31799/1684-8853-2020-1-15-23 [CrossRef] [Google Scholar]
- E.V. Bychkov, A.V. Bogomolov, K.Yu. Kotlovanov, Bulletin of the South Ural State University. Ser. Mathematical Modelling, Programming & Computer Software, 13(2), 33–42 (2020). Doi: 10.14529/mmp200203 [Google Scholar]
- I.B. Ushakov, A.V. Bogomolov, Iu.A. Kukushkin Ross Fiziol Zh Im I M Sechenova, 100(10), 1130–1137 (2014) [PubMed] [Google Scholar]
- M.D. Alekhin, A.V. Bogomolov, Yu.A. Kukushkin, Aerosp Ecol Med, 2, 99–101 (2019). Doi: 10.21687/0233-528X-2019-53-2-99-101 [CrossRef] [Google Scholar]
- Z.M. Kuznetsova, J.D. Ovchinnikov, L.V. Horkova, Pedagogico-psychological and medico-biological problems of physical culture and sport, 12(1), 14-21 (2017) [Google Scholar]
All Figures
|
Picture. 1. Histogram of resonance frequency distribution in the group of influence and control for different phases of respiration (according to abscise axisresonance frequency f0, according to axis of ordinatesthe amount of observations; diagonal ruling from left to right, upwardthe regimen of inhalation, diagonal ruling right to left, upwardregimen of exhalation, horizontal hatchingregimen of free respiration; solid line of density of probability corresponds with inhalation, dotted line corresponds with the exhalation, dotted linefree respiration). |
| In the text | |
Current usage metrics show cumulative count of Article Views (full-text article views including HTML views, PDF and ePub downloads, according to the available data) and Abstracts Views on Vision4Press platform.
Data correspond to usage on the plateform after 2015. The current usage metrics is available 48-96 hours after online publication and is updated daily on week days.
Initial download of the metrics may take a while.