Figure 1.
Download original image
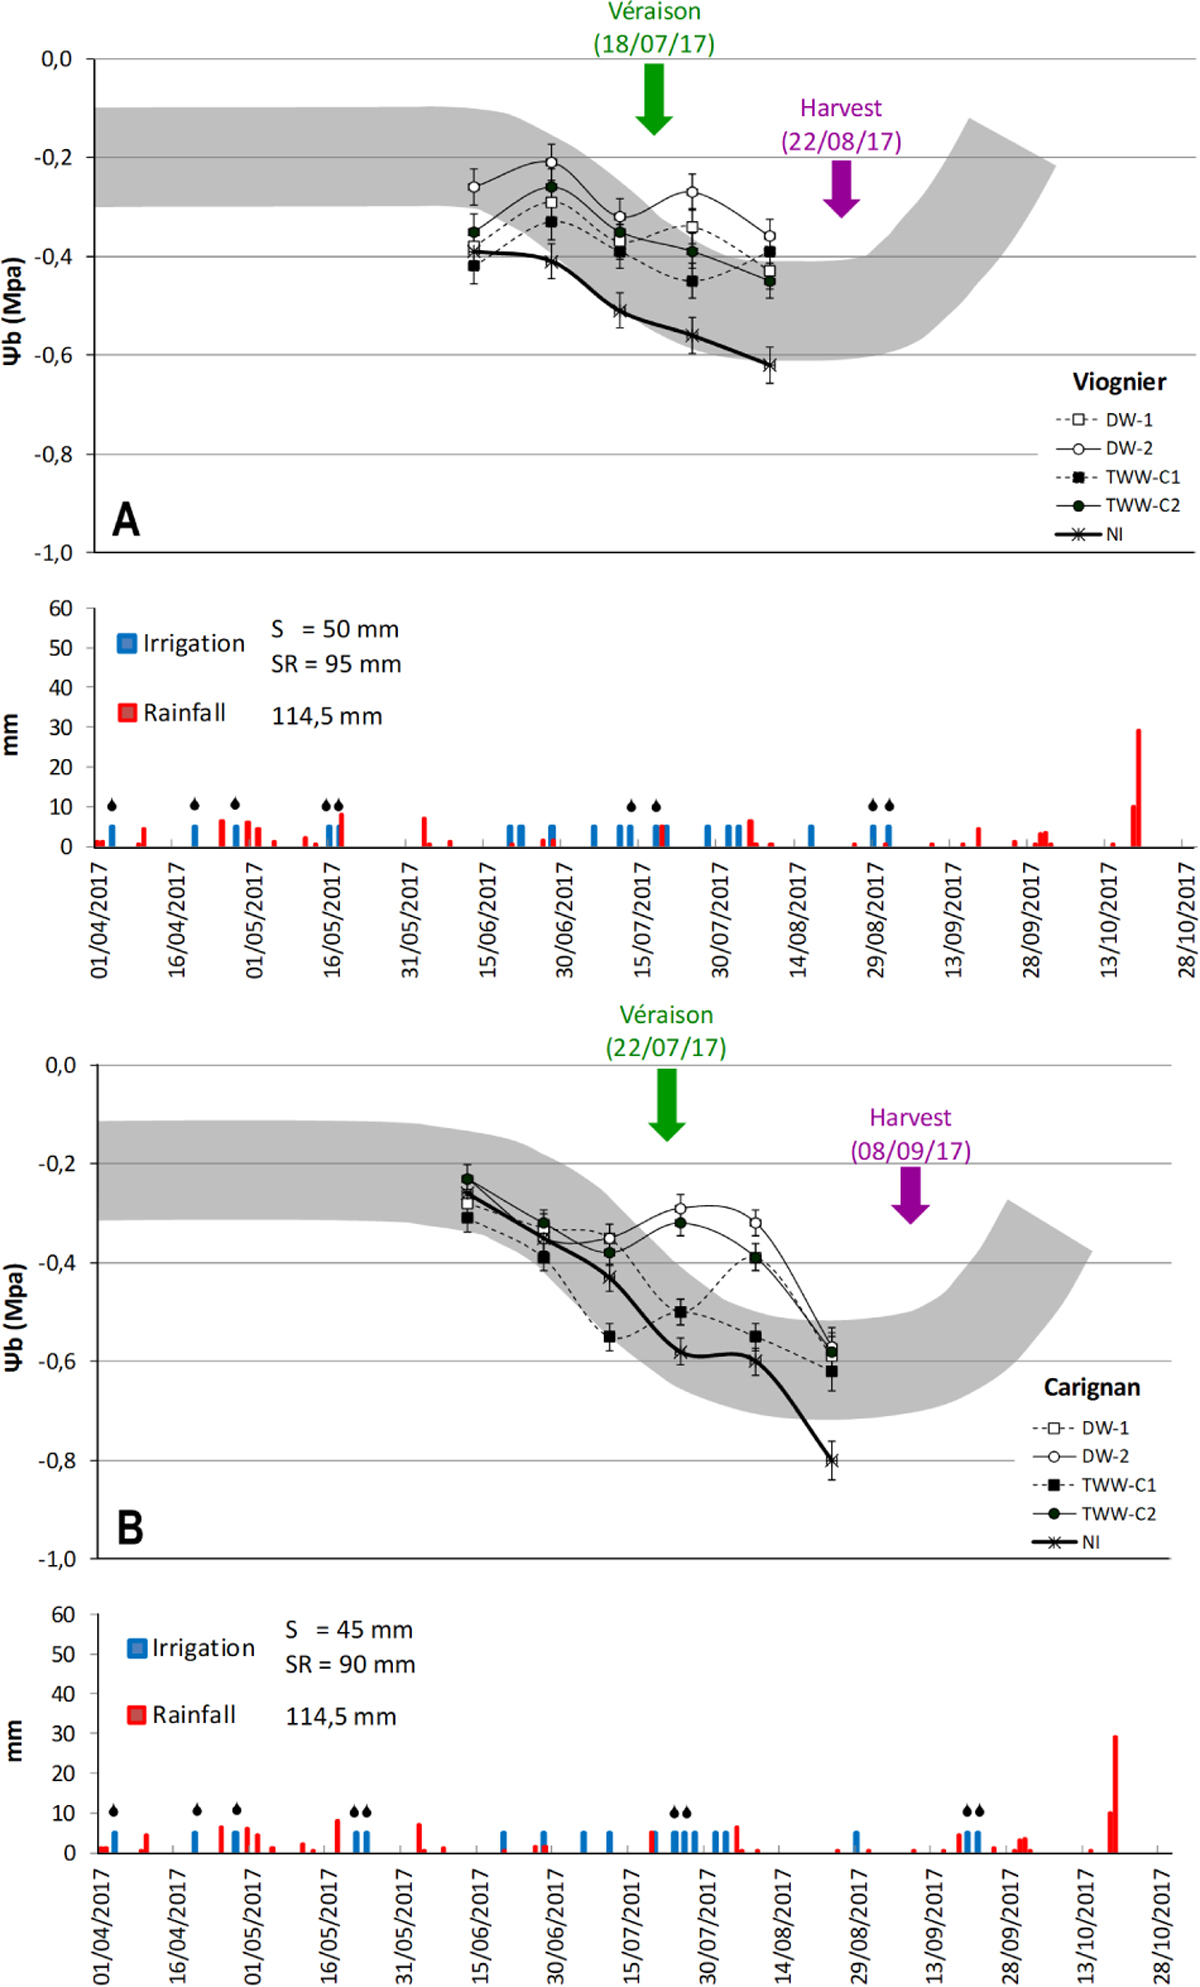
Predawn leaf water potential evolution (Ψpd)Vitis vinifera L Viognier/SO4 (A) and Carignan/R110 (B) during growing season 2017. Each point represents the average of n = 3 plants and bars indicate the minimal significant differences (LSD test, p > 0.05). The grey area indicates the reference values according to a predawn leaf water potential model [32]. Bar graph shows irrigations ![]() (
(![]() reinforced irrigation, only treatment subplot 2) and rainfall
reinforced irrigation, only treatment subplot 2) and rainfall ![]() .
.
Current usage metrics show cumulative count of Article Views (full-text article views including HTML views, PDF and ePub downloads, according to the available data) and Abstracts Views on Vision4Press platform.
Data correspond to usage on the plateform after 2015. The current usage metrics is available 48-96 hours after online publication and is updated daily on week days.
Initial download of the metrics may take a while.