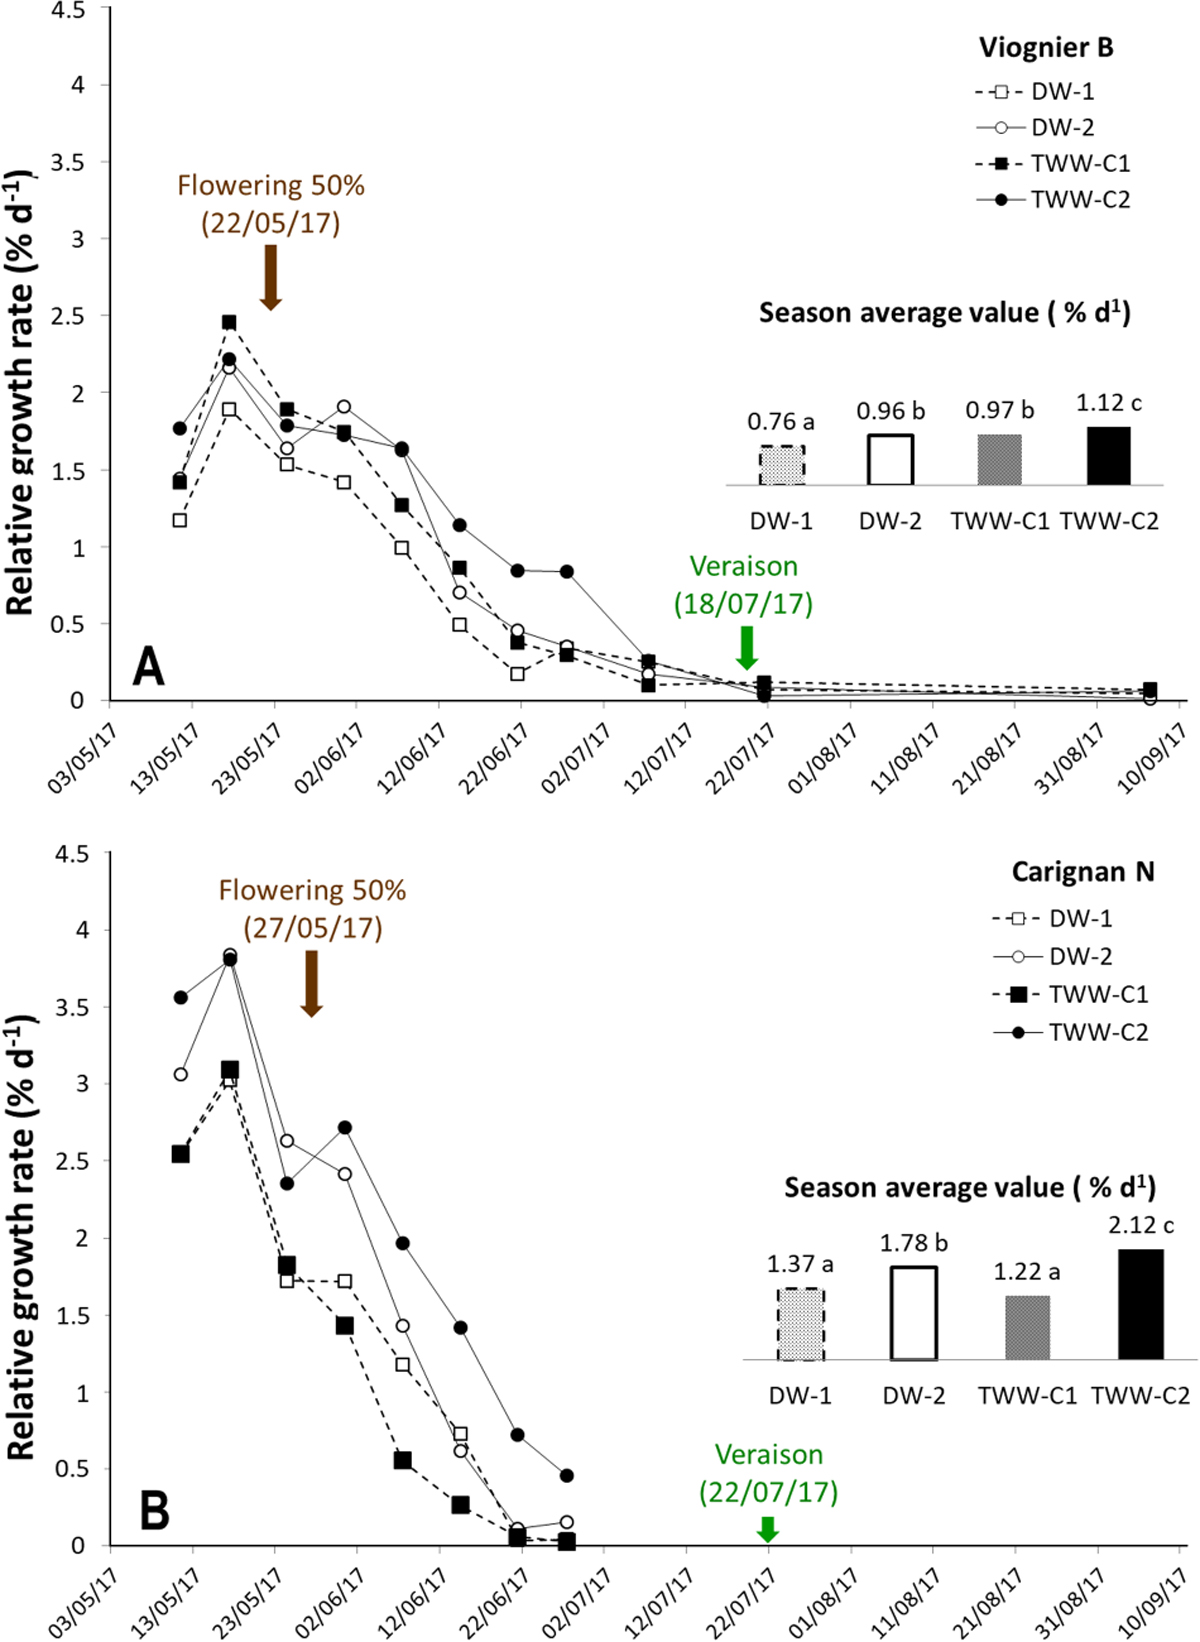
Figure 3.
Download original image
Relative growth rates (RGR) for Viognier B (A) and Carignan N (B) vines irrigated with treated wastewater quality C (TWW-C) and drinking water (DW), during 2017 growing season. Each point represents the average of n = 12 shoots. Bar graph shows average value over growing season and different letters indicate a significant difference at p > 0.05 (LSD test).
Current usage metrics show cumulative count of Article Views (full-text article views including HTML views, PDF and ePub downloads, according to the available data) and Abstracts Views on Vision4Press platform.
Data correspond to usage on the plateform after 2015. The current usage metrics is available 48-96 hours after online publication and is updated daily on week days.
Initial download of the metrics may take a while.