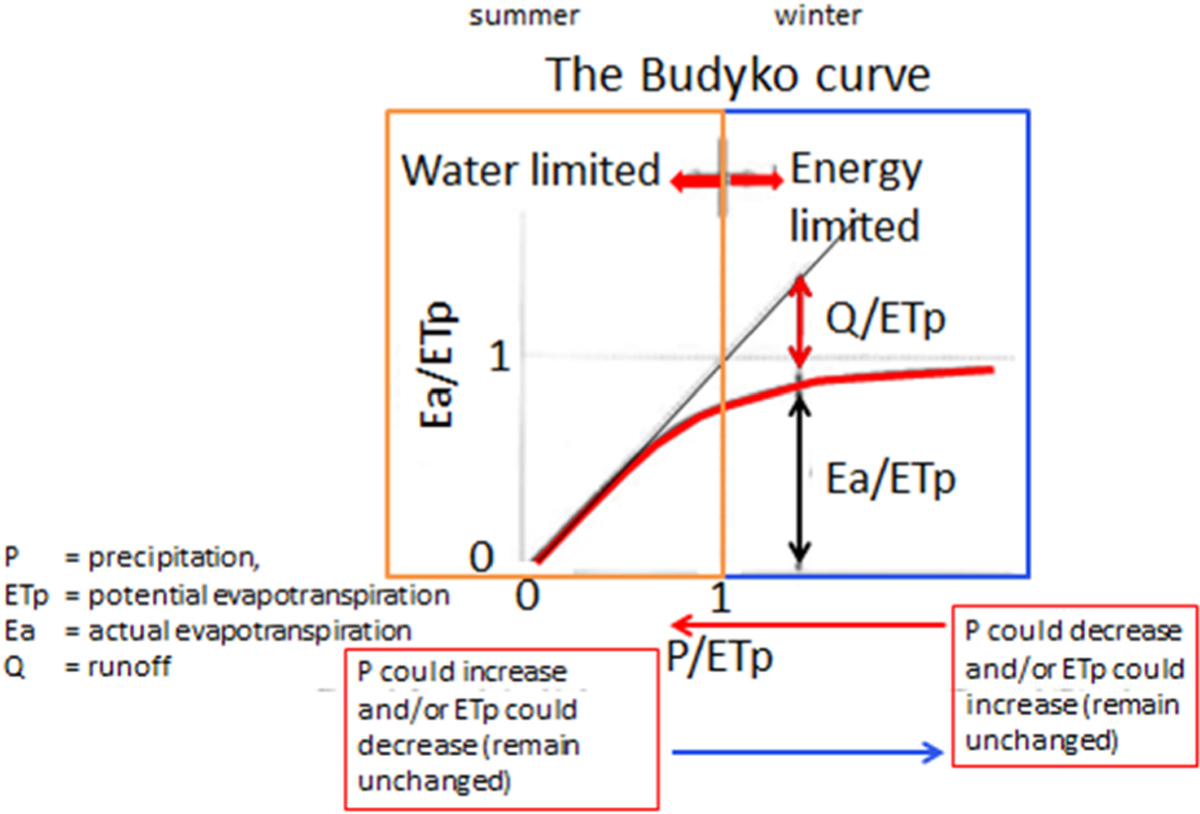
Figure 1.
Download original image
Inter-relationship between average precipitation (P), actual (Ea) and potential (ETp) evapo-transpiration and runoff (Q) and how season and climate change could affect this inter-relationship depending on the region. Grape growing areas are represented in both water and energy limited areas and the effect of climate change might be substantially different for different parts of the world. The original curve is known as the Budyko curve [17] and the presented figure is an adaptation from Farquhar and Roderick [8] in an extended version.
Current usage metrics show cumulative count of Article Views (full-text article views including HTML views, PDF and ePub downloads, according to the available data) and Abstracts Views on Vision4Press platform.
Data correspond to usage on the plateform after 2015. The current usage metrics is available 48-96 hours after online publication and is updated daily on week days.
Initial download of the metrics may take a while.