Open Access
Figure 5.
Download original image
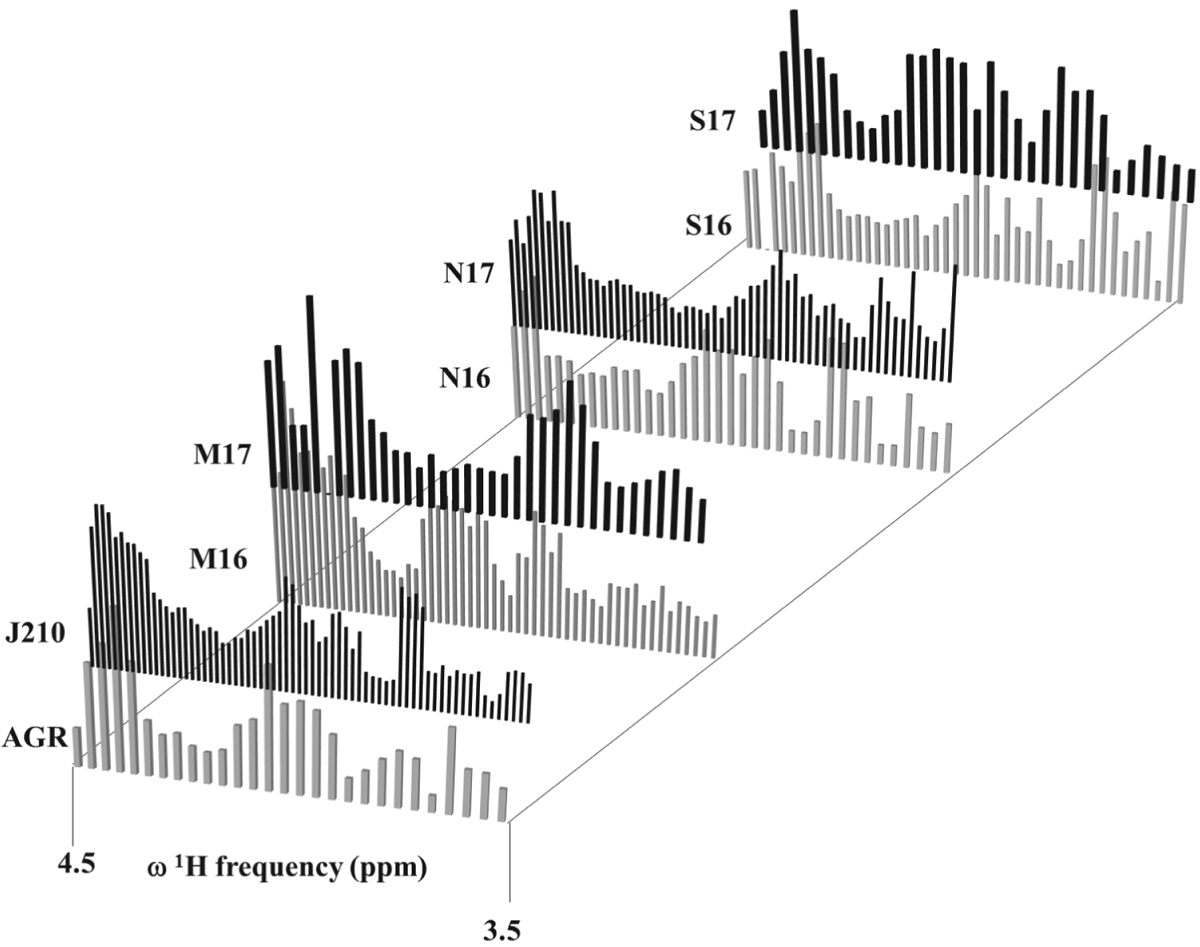
Histogram distribution of spin-lattice relaxation computed values (T1-{1H}) with the Wine- T1 approach, within the frequency range between 3.5 – 4.5 ppm of wine samples AG, J210, M16, M17, N16, N17, S16 and S17. To refer the exact T1−{1H} value, see Fig. 4.
Current usage metrics show cumulative count of Article Views (full-text article views including HTML views, PDF and ePub downloads, according to the available data) and Abstracts Views on Vision4Press platform.
Data correspond to usage on the plateform after 2015. The current usage metrics is available 48-96 hours after online publication and is updated daily on week days.
Initial download of the metrics may take a while.