Open Access
Fig. 1
Download original image
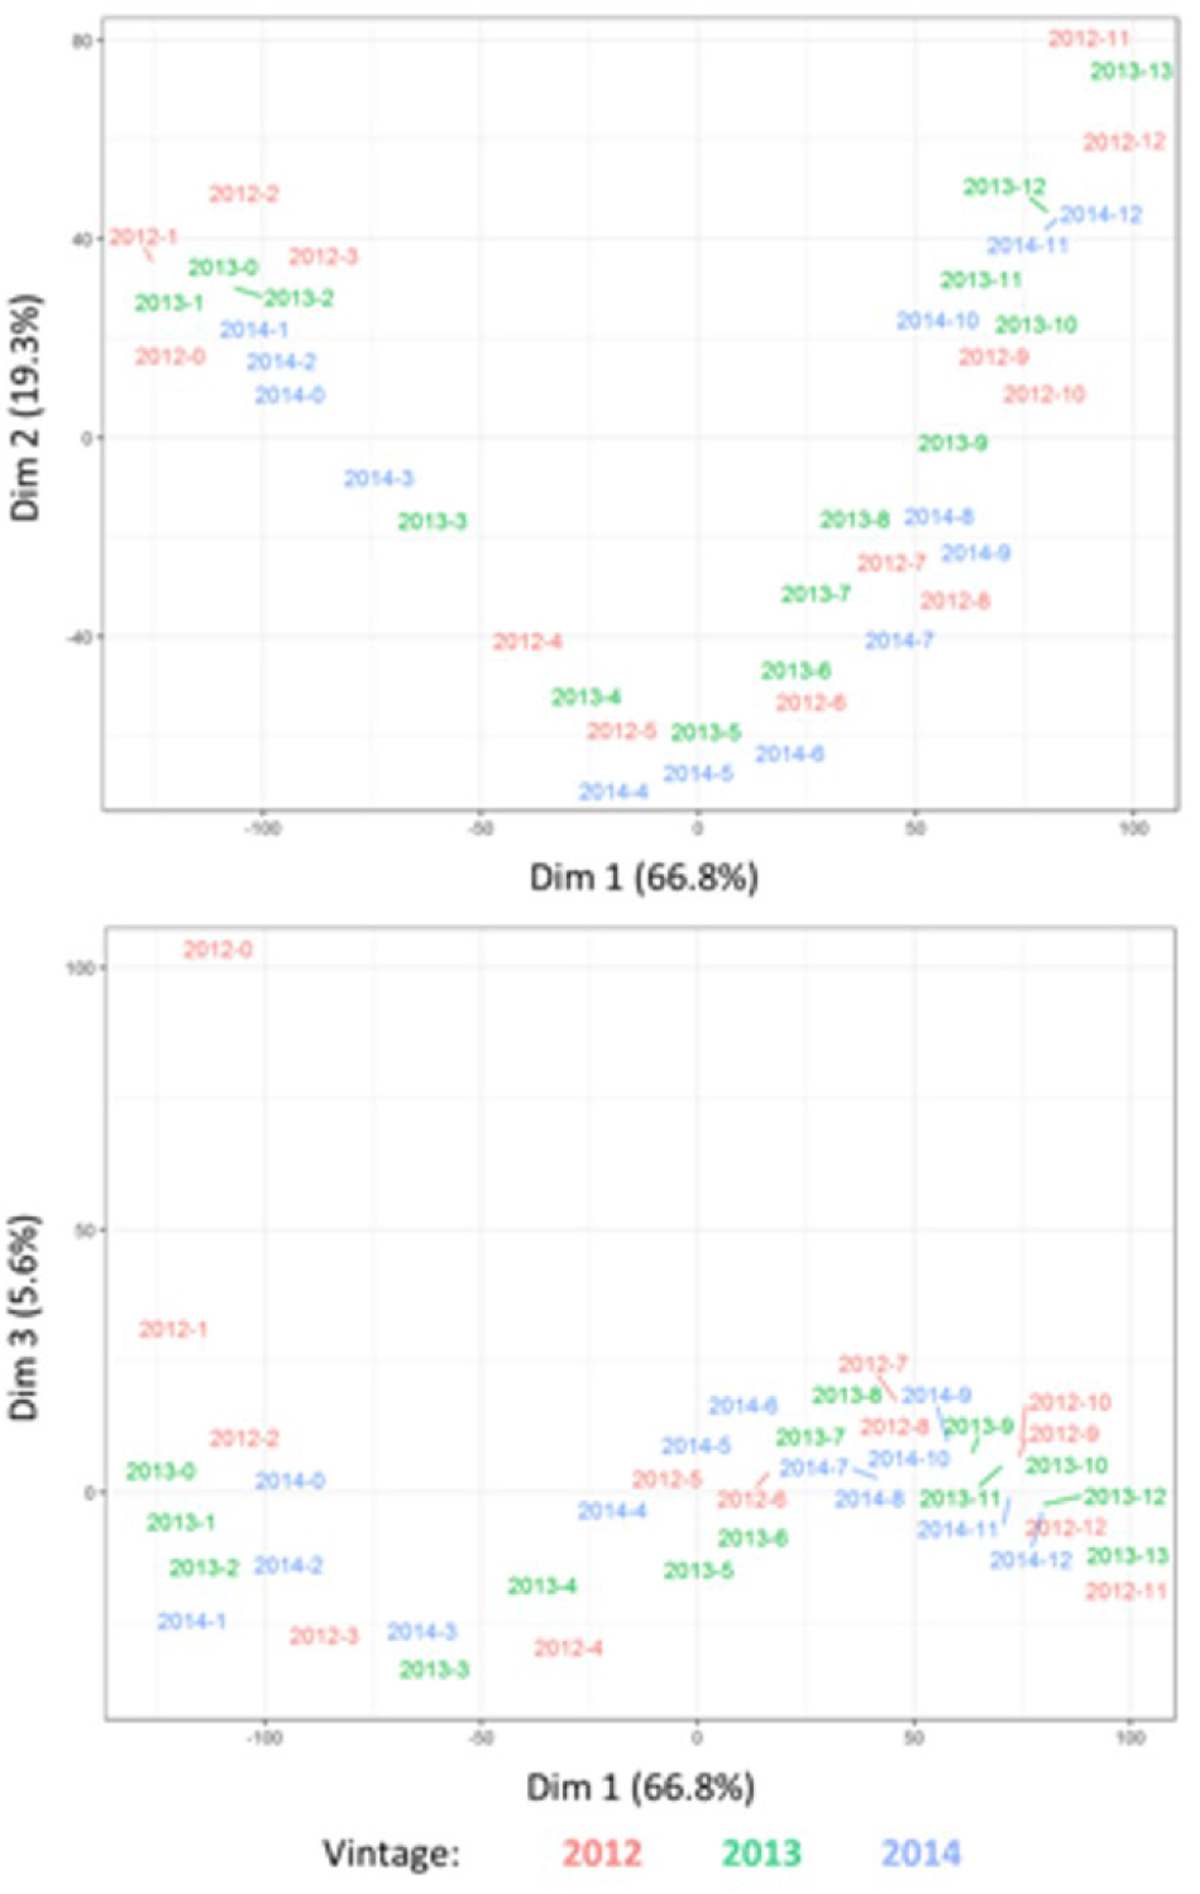
Principal component analysis showing the distribution of gene expression in Cabernet Sauvignon berries for all three vintages. Dim 1 and Dim 2 explain 86.1% of the variance (top plot). Dim 1 and Dim 3 explain 72.4% of the variance (bottom plot). Samples represent averaged biological triplicates.
Current usage metrics show cumulative count of Article Views (full-text article views including HTML views, PDF and ePub downloads, according to the available data) and Abstracts Views on Vision4Press platform.
Data correspond to usage on the plateform after 2015. The current usage metrics is available 48-96 hours after online publication and is updated daily on week days.
Initial download of the metrics may take a while.