Fig. 2
Download original image
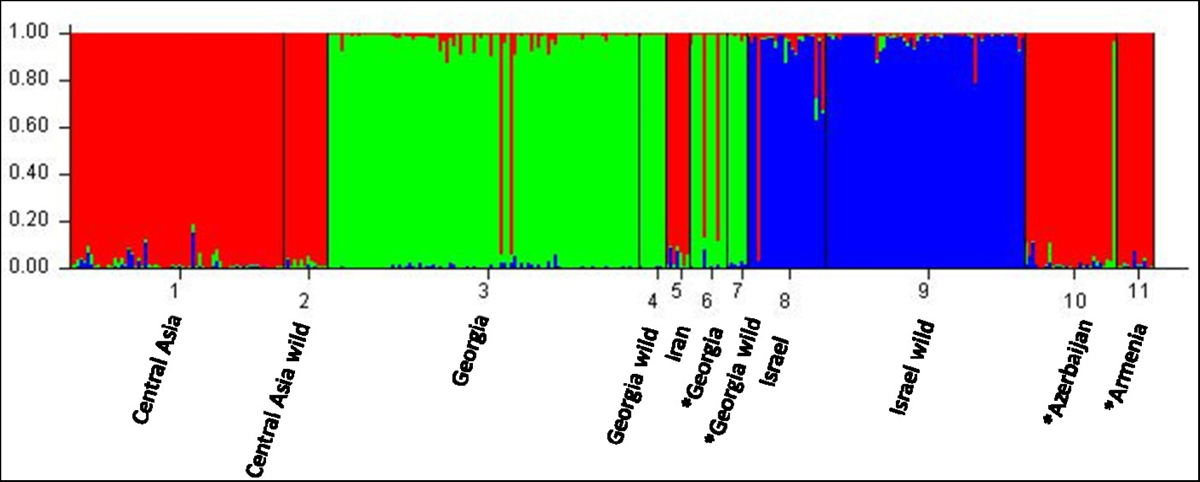
Genetic population structure for K=3. Each unique SSR genotype is shown as a vertical line portioned into segments representing the estimated coefficients of membership proportion in the three genetic clusters inferred with STRUCTURE. Regional populations also investigated at resistance loci (examples in Table 2 and Table 3) are indicated by an asterisk (*).
Current usage metrics show cumulative count of Article Views (full-text article views including HTML views, PDF and ePub downloads, according to the available data) and Abstracts Views on Vision4Press platform.
Data correspond to usage on the plateform after 2015. The current usage metrics is available 48-96 hours after online publication and is updated daily on week days.
Initial download of the metrics may take a while.