Fig. 1
Download original image
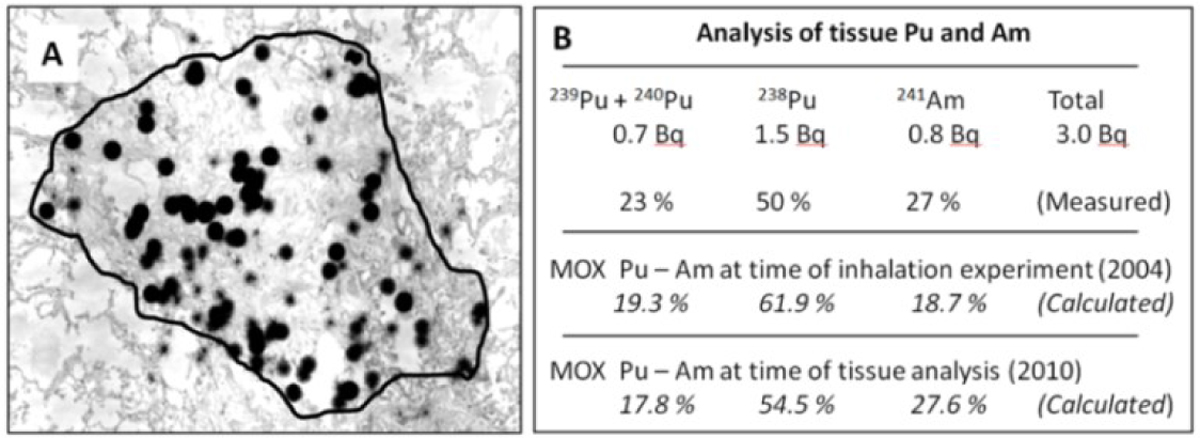
A: Autoradiograph (emulsion) of rat lung section with aggregates of activity in a fibrotic zone after inhalation of MOX (7,1 % Pu). Counter staining haematoxylin-eosin. The delimited area was dissected using a microscope and fine needles. The tissue was weighed and analysed for Pu and Am following column separation and alpha spectrometry. B: Table showing measured Pu or Am activity in the dissected tissue and the different calculated isotopic fractions of MOX either at the time of inhalation (2004) or time of tissue analysis (2010).
Current usage metrics show cumulative count of Article Views (full-text article views including HTML views, PDF and ePub downloads, according to the available data) and Abstracts Views on Vision4Press platform.
Data correspond to usage on the plateform after 2015. The current usage metrics is available 48-96 hours after online publication and is updated daily on week days.
Initial download of the metrics may take a while.