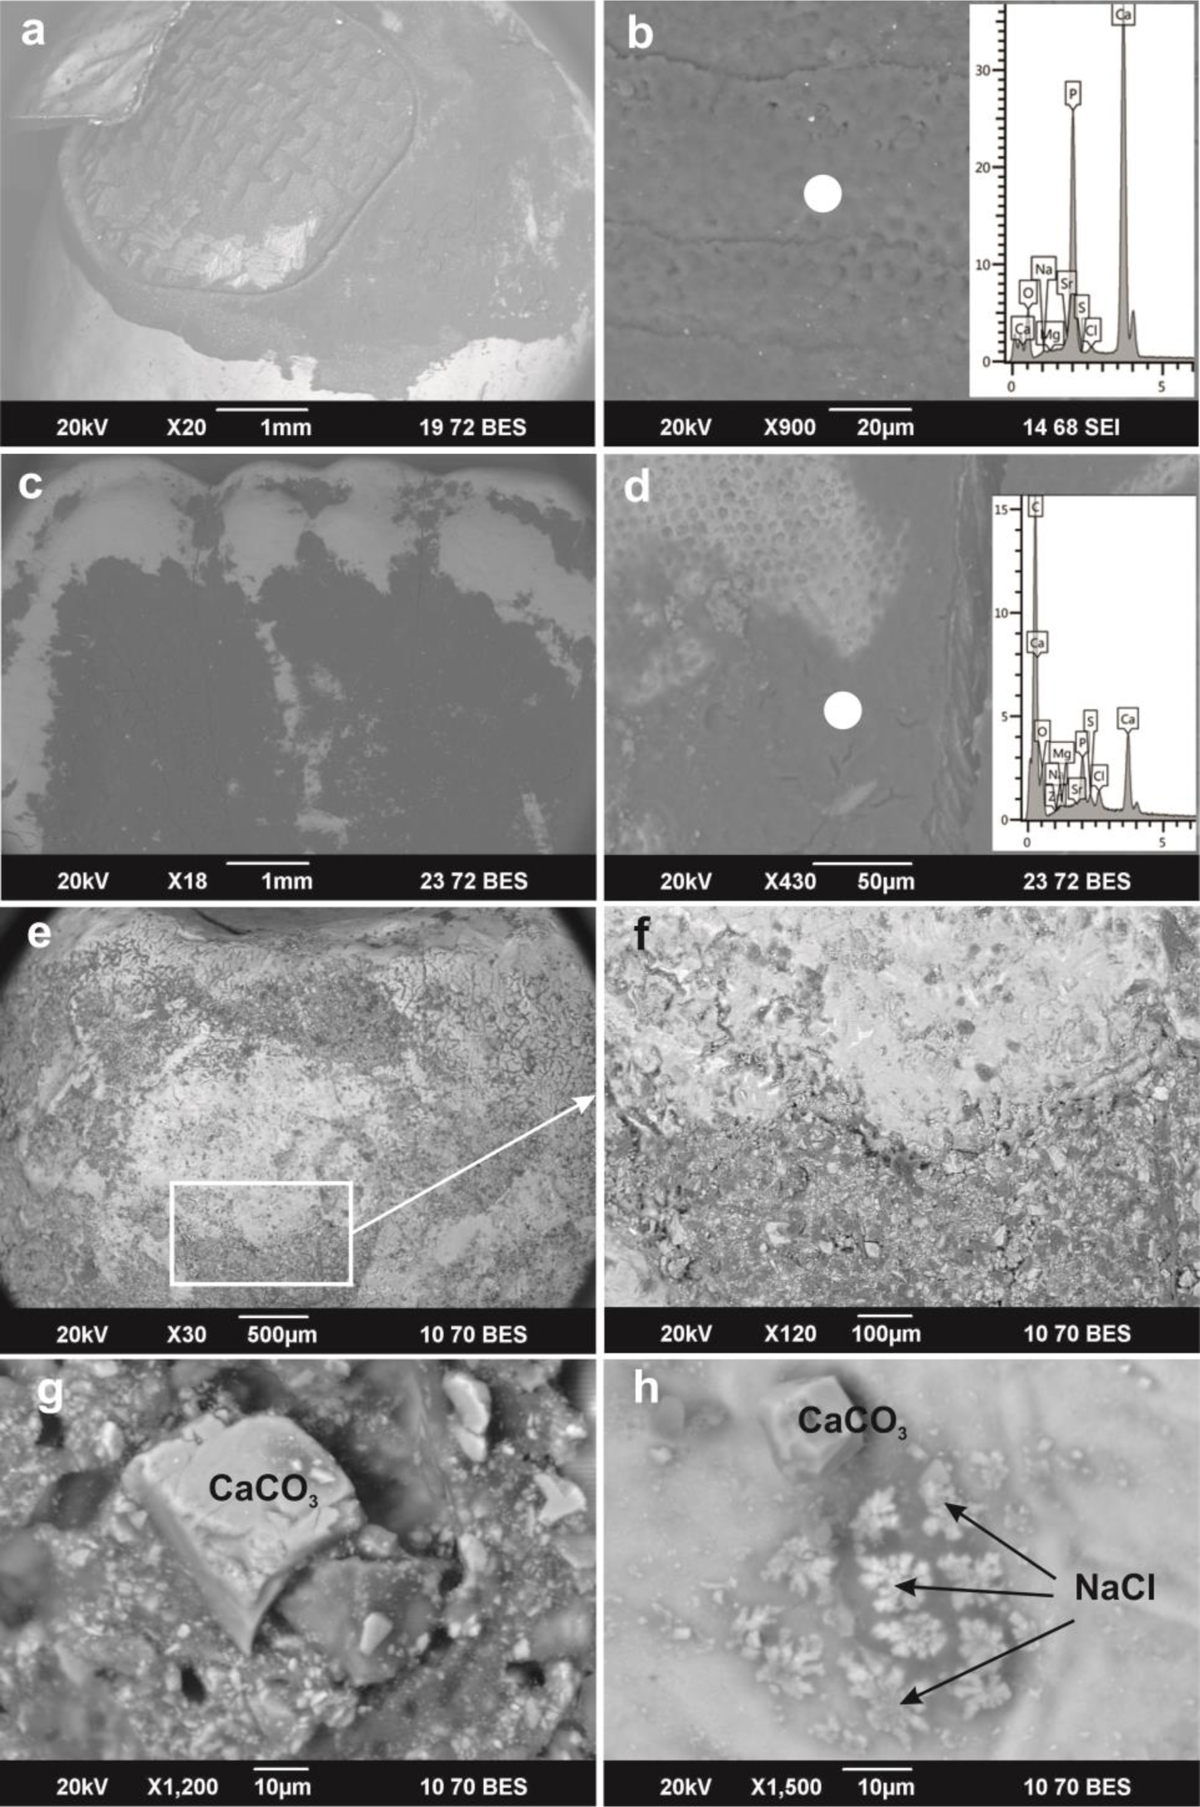
Fig. 2.
Download original image
SEM images of intact (a-b) and hypoplastic (c-h) teeth. Dark color corresponds to the regions with high organic content (see EDS spectrum) (d). Regular prismatic structure of enamel is clearly visible (b,d) with EDS spectra corresponding to hydroxyapatite mineral. A boundary between dark and light spots on enamel surface (e,f) is identified discriminating the mineralized region from organic-enriched area, which is characterized by newly-formed (calcite, halite) mineral deposition (g,h). Filled white circles are EDS analytical points.
Current usage metrics show cumulative count of Article Views (full-text article views including HTML views, PDF and ePub downloads, according to the available data) and Abstracts Views on Vision4Press platform.
Data correspond to usage on the plateform after 2015. The current usage metrics is available 48-96 hours after online publication and is updated daily on week days.
Initial download of the metrics may take a while.