Fig. 2
Download original image
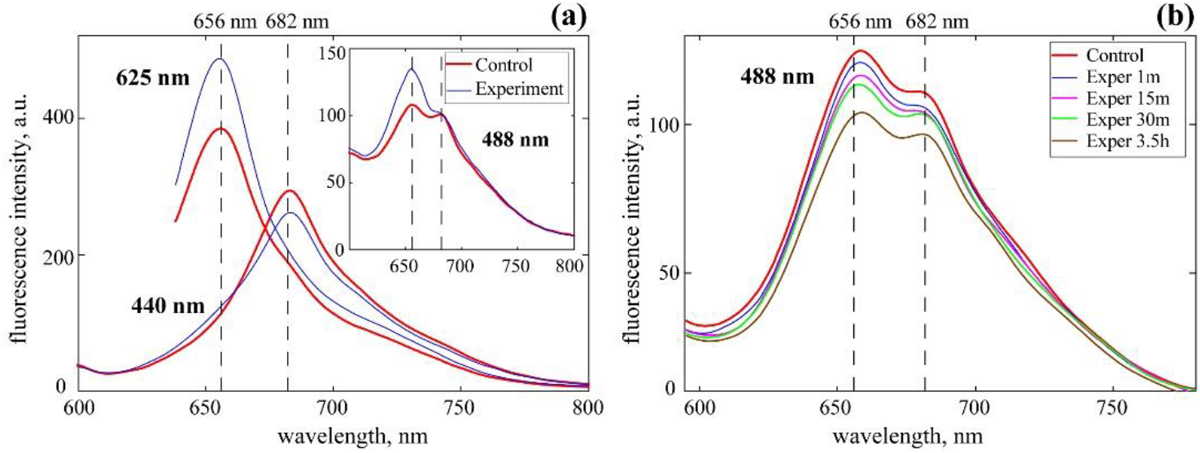
Changes in fluorescence intensity and spectral composition at physical (a) and chemical (b) treatment of Synechocystis aquatilis CALU 1336. (a) – three-days ultrasound treatment of cyanobacterial culture. Excitation wavelengths are shown next to the curves. Inset shows the effect at excitation wavelength 488 nm. (b) – fast dynamics of fluorescence changes during 2 mg/l copper sulfate pentahydrate treatment (CuSO4 x 5H2O). Excitation wavelength 488 nm. Spectra were recorded at 1, 15, 30 and 210 min (3.5 hours). Vertical lines indicate wavelengths for fluorescence maximum of phycocyanin (656 nm) and chlorophyll a (682 nm).
Current usage metrics show cumulative count of Article Views (full-text article views including HTML views, PDF and ePub downloads, according to the available data) and Abstracts Views on Vision4Press platform.
Data correspond to usage on the plateform after 2015. The current usage metrics is available 48-96 hours after online publication and is updated daily on week days.
Initial download of the metrics may take a while.