Fig. 3
Download original image
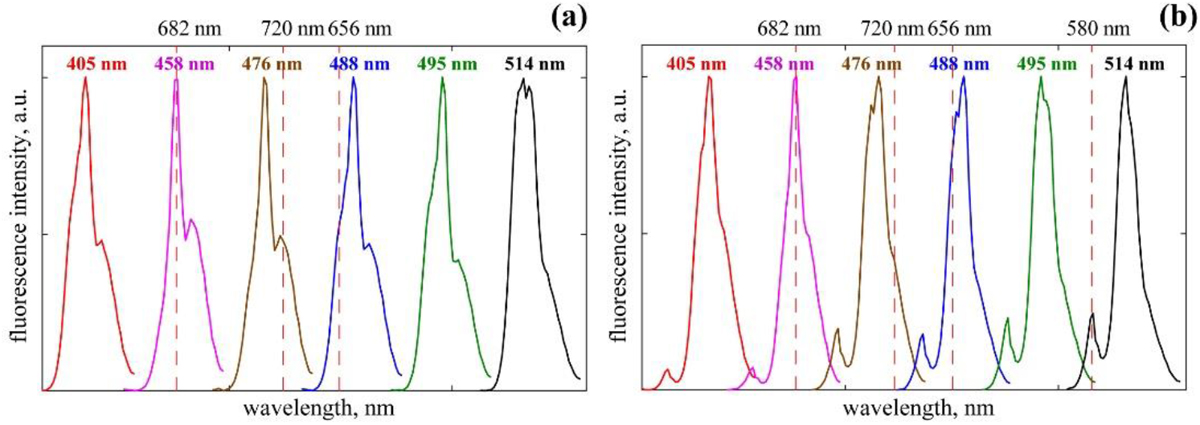
Two characteristic sets of single-cell fluorescence spectra for Spirulina platensis CALU 550 and Merismopedia punctata CALU 666. The excitation wavelengths (405, 458, 476, 488, 496, 514 nm) are given over the curves. All spectra are normalized to the maximum intensity and shifted along x-axis for convenience of observation. The dashed lines indicate fluorescence maxima of the individual pigments (PE – 580 nm; PC – 656 nm; Chl a – 682, 715 nm).
Current usage metrics show cumulative count of Article Views (full-text article views including HTML views, PDF and ePub downloads, according to the available data) and Abstracts Views on Vision4Press platform.
Data correspond to usage on the plateform after 2015. The current usage metrics is available 48-96 hours after online publication and is updated daily on week days.
Initial download of the metrics may take a while.