| Issue |
BIO Web Conf.
Volume 13, 2019
CO.NA.VI. 2018 - 7° Convegno Nazionale di Viticoltura
|
|
|---|---|---|
| Article Number | 02005 | |
| Number of page(s) | 5 | |
| Section | Site Selection and Precision Viticulture | |
| DOI | https://doi.org/10.1051/bioconf/20191302005 | |
| Published online | 01 April 2019 | |
VINESYM: an integrated vine and grapevine mathematical model for vegetative development and production quality forecast
TEA Engineering s.r.l, Via Ponte a Piglieri, 8,
56121, PISA
* Corresponding author: vittorio.faluomi@tea-group.com
The present work deal with the development of a mathematical model able to predict, using time dependent meteorological data, soil and vine characteristics, the growing of a vine and grapevine in terms of leaf area, shoot length, fruit and vegetative mass and finally sugar and acid content of the berry. The model is based upon a source-sink relationship approach, integrated with a soil-atmosphere model, where water accumulation in soil, sap flow across vine are coupled with potential carbon demand functions to directly consider possible water and temperature stresses. The model includes also a N2 sink-source approach, limiting growth rate following N2 availability. Finally, a mechanistic model to evaluate sugar accumulation and a correlation-based model for acid concentration evaluation in the berry is coupled with vegetative growth, to provide the information required to manage vineyard operations and evaluate the impact to the potential wine quality. The primary distinctive trait of this model is then the integration and feedback among prediction of grapevine quality model (sugar an acid content) and vegetative growth model, using a common initial ad boundary conditions data set.
© The Authors, published by EDP Sciences, 2019
 This is an Open Access article distributed under the terms of the Creative Commons Attribution License (http://creativecommons.org/licenses/by/4.0), which permits unrestricted use, distribution, and reproduction in any medium, provided the original work is properly cited.
1 Introduction
Quality and production of vineyards (Vitis vinifera L.) are influenced by a great number of interrelated factors. Environmental factors (e.g. water stress) and cultivation practices, including irrigation, might modify this carbon balance and affect fruit size, quality and yield (1,2,3). In addition, climate change will alter meteorological conditions in the near future and this might affect grape yields and grape composition for high-quality wine production (4). In general, a comprehensive crop model should fulfill the following desirable and concurrent features: i) limited requirements as input data; ii) high degree of user-friendliness in terms of usability and output visualization and interpretation; iii) reasonable accuracy of produced outputs and, iv) large spectrum of results including quality indicators of final product (5). Ideally, a model should be accessible, understandable and useable by those other than the model developers. Number of models have been developed for assessing plant growth and physiology, and they have been adapted to different crops (6). In the case of grapevines, there are models which accurately predict specific processes such as phenology (7), vegetative growth and yield (8), sugar accumulation (9), carbon assimilation and allocation (10). Nevertheless, these models do not comprehend all the desirable features listed above. Grapevine in commercial production can be a difficult subject for modeling due to the extreme manipulations by growers such as variable pruning, training, shoot selection, canopy shoot positioning, leaf removal, hedging, cluster thinning, etc. In addition, those models often neglect fundamental phenomena like subsoil water balance, root-soil interaction, soil-plant atmosphere exchange and finally feedback on production quantity (fresh mass) and quality (sugar and berry pH). Thus, modeling grapevines should not attempt excessively detailed simulations as results will have limited value to other conditions (11,12,13). The present work deal with the development of a mathematical model able to predict, using time dependent meteorological data, soil and vine characteristics, the growing of a vine and grapevine in terms of leaf area, shoot length, fruit and vegetative mass and finally sugar and acid content of the berry. The aim of this research is to provide a reliable tool to investigate impact of climate changes into grapevine and wine production and quality. The model was tested with experimental data from two different Italian regions (Tuscany and Umbria) and different cultivars and used to estimate dry mass accumulation of those vineyard during two consecutive years (2016 and 2017) to identify the impact of different climate scenarios on grapevine development. Results of the first model simulations are presented. Data requirements, and limits and improvements of the model are discussed.
2 Materials and Methods
1.1 Plant material and field data collection
Data records for calibration purposes were taken in 2016 and 2017 in a vineyard established since 1970 at Montecarlo di Lucca (43°51′N, 10°40′ E Italy), and featuring a Guyot training systems in a North–South row orientation. Data were taken for the following cultivars: Sangiovese, Cabernet, Chardonnay, Trebbiano, Vermentino and Roussanne. No information about clone type and stock where available. Average plant density was 4000 plants/hectare (1.2 m x 1.8 m spacing), and the trellis frame featuring a main support wire holding the cane (cordon) at 0.9 m above the ground surmounted by a fixed wires placed respectively at 1.2 m and 1.8 m from the ground. Shoot trimming was performed once on middle of June 2016 when shoots outgrew the top wires. Data were taken on selected test rows (30% of the total) in three different points (both row ends and center), randomly choosing a different vine every measurement to increase statistical reliability of data. Four spurs per wine were counted in average after pruning, with 2 buds for each. In 2017, same measurements were performed in two additional sites: Terricciola (43°31′32″N 10°40′51″E) and Tuoro sul Trasimeno, (43°12′N 12°5′E), where similar cultivar with same training system were considered. With reference to phenological monitoring, vegetative and reproductive stages were classified according to the GDD scale (13). The following parameters were monitored, and data collected during veraison and ripening phase:
-
Air temperature and relative humidity
-
Leaf and berry surface temperature
-
Surface Soil Humidity
-
Berry sugar content
-
Berry pH
-
Berry diameter
-
Vine leaf area at harvest
-
Vine production
In addition, temperature and rainfall data were also taken from meteorological stations nearby vineyard and properly averaged. Some example of the data collected and used for model tuning and assessment are reported in Fig. 1 and Fig. 2.
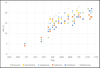 |
Fig. 1 Berry sugar accumulation trend (2016) |
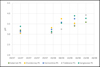 |
Fig. 2 Berry pH trend (2017) Berry |
1.2 Model overview
The prediction model has been derived by sink-source approach presented by (1),(10) and (8) modified to take into account water and nutritional stresses and using a full set of daily based meteorological data to evaluate the vine development during a given time frame. In addition, sugar and acid accumulation within the berry is evaluated during the time. The model simulates grapevine growth and development as summarized in Fig. 3, where variables are represented as boxes and mathematical models as diamonds, respectively. The meteorological input data of the model are represented by daily maximum and minimum temperatures and daily total precipitation. A simplified soil water balance model is providing time step-based soil water content, as well as the nutritional model provide N2 content in the root zone. Phenological state are modelled following (14). The carbon demand has been evaluated using an empirical correlation for leaf area growing, and a full photosynthetic model based on calculated leaf surface temperature is used to evaluate carbon supply. The ratio among the two phenomena is the sink-source coefficient which is the growing limiting factor of the vineyard and the berry. Finally, a berry sugar accumulation model (based on dry mass and fresh fruit mass increment) is applied to evaluate the berry sugar trend accumulation increase, including already possible stresses due to lack of carbon storage or N2 availability
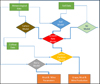 |
Fig. 3 Model Structure |
1.3 Thermal-Hydrological model, water content and soil temperature prediction
The soil model implemented in VINESYM includes both a module for water content calculation (θact, mm within the soil layer explored by roots) and a soil energy balance model, required to evaluate soil evapotranspiration for soil water balance calculation. The two modules are implemented so far:
Δθact/dt = RR - PR - RD - ETRS(Tsoil) - Ru (1)
λΔTsoil/dt = Rn − Hg − He (2)
where Δθact= (θact,d- θact,d-1) is soil water content gradient at day d and d−1, RR is daily rainfall, Ru is daily surface runoff, RD is the root uptake rate (16), Pr is daily percolation on deep soil (17) and ETRS is daily soil evapotranspiration (18). RR is obtained with direct measurements while Ru is estimate assuming water runoff proportional to the soil slope. The above parameters are calculated as follow:
1.4 Plant-atmosphere model and leaf potential evaluation
To evaluate possible plant water stress a balance among transpiration, sap flow and root uptake potential is required to provide reliable evaluation of available water for dry mass prediction through photosynthesis. The sap flow along the vine system is described using a model below (19):
CplantΔW/dt=(ψsoil,ψleaf)/rplant-ETRP(Tleaf,ψleaf) (3)
Where Cplant is the water capacitance of plant, ΔW the daily variation of water storage within the plant, ETRP the actual evapotranspiration (ETRP, 20) and ψsoil and ψleaf are the soil and leaf water potentials (responsible for sap flow across vine) and rplant is the plant resistance to the sap flow. From the model above reported, the actual water storage of the leaf and berry is evaluated, and possible water stresses are automatically considered from overall mass and momentum of sap balance.
1.5 Radiation and leaf temperature model
The leaf superficial temperature has been retained necessary both to characterize the phenological stages of the vine and to be used in the evaluation of the limiting factors for carbon supply mechanism. In addition, leaf temperature impact in the evapotranspiration phenomena, through stomatal opening degree, and finally in the evaluation of leaf damage due to solar radiation. The leaf superficial temperature model has been based on the work of (21) and (22) The model considers boundary layer heat exchange and stomatal opening mechanisms, and has been implemented as follow:
IR = ϵ • σ • (Tleaf)4 + hc • (Tleaf − Ta) + λ (e1 − ea)/rtot (4)
Where IRn is the incoming radiation, Ta is air temperature, Tleaf is the leaf temperature,el and ea are water and air saturation pressure, σ is the Stephan Boltzman, ε is the emissivity, hc is the heat transfer coefficient and rtot is the stomatal resistance.
1.6 Carbon supply and demand balance
The carbon pool available for distribution is the daily assimilated carbon (PHO) plus that mobilized from reserves if necessary (STO). As the model focuses on the allocation and utilization of assimilates, PHO (g/d) is simply estimated as the daily product of incoming photosynthetic radiation above the canopy (Rtot), a light interception function based on an exponential Beer-Lambert attenuation law, and radiation use efficiency (RUE) i.e. the amount of carbon accumulated per unit irradiance intercepted:
PHO = Rtot*RUE * F(T) * F(LAI) * pld (5)
F(LAI) = 1 - e(-Kext*LAI) (6)
where pld is the plant density(m2/plant), Kext and LAI are the light extinction coefficient (10), (8) and the leaf area index (i.e. total canopy leaf area per unit ground area), respectively. RUE is variable in time and primarily depends on radiation intensity, temperature and nutrient availability (23), (8). Concerning carbon demand, the model is based on (1) and (10) work, with some modifications and simplifications. The carbon mass accumulation due to vegetative growth is simulated through the following relationship:
CD = (VM + FDM) * (1 − R) (8)
where CD is the total carbon demand, FDM is the fruit dry mass, VM is the vegetative mass and R is the respiration factor (carbon fraction not transformed in vegetative mass). The total vegetative mass if proportional to the leaf mass through a parameter k1 (1), where the leaf mass increment is given by the mass of leaves available at day i and the new leaves created at day i+1:
VM = k1(nleaves,i+1 * GLF * GDD10)ρleaves (9)
where ρleave is the specific mass of leave (calculated as 240 kg/m3 as average for all considered cultivars) and GLF is the growing leave factor. The increment of leaves mass is related to the heat accumulated and simulated using the GDD (growing degree days) with a base temperature of 10°C. The fruit dry mass is instead calculated starting from dry mass of the berry multiplied by the average number of berries for a cluster and the number of a cluster per vine (data related to each cultivar). The berry mass mberry has been evaluated using a model derived by (24), where water content has been evaluated by Eq.3.The final fruit dry mass is then the berry mass multiplied by NCcluster and NBberry (number of clusters per vine and number of berries per cluster, input data depending from cultivar)
FDM = NCcluster * NBberry * mberry (10)
1.7 Nitrogen balance model and nutritional stress
The nitrogen balance model is based on the same paradigm source-sink as for the carbon matter. The available N2 amount is evaluated as follow (25). The N2 demand is evaluated using the approach of (26), where N2 is a function of GDD10 both for leaves and berries.
1.8 Sugar accumulation model
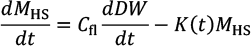
The sugar accumulation is predicted using the model from (9), based on the following time-dependent balance equation:
 (11)
(11)
where MHS is the sugar mass, DW is the berry dry mass, Cfl is the carbon transfer rate coefficient, K(t) the sugar metabolic consumption and dt the time step of equation. The sugar content is then evaluated solving the above equation using an explicit method.
1.9 Acid concentration
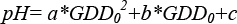
The accumulation of acids within the berry has been simulated using a correlation tuned on field data. Which depend on GDD0, the growing degree days’ scale using 0° as base temperature and a, b and c where tuned over recorded field data. Based on this correlation and the work of (27), a correlation has been used to calculate TA, the total fixed acidity concentration (g/l))
 (12)
(12)
TA = -10.754 * pH + 51.033 (13)
3 Results
The model has been validated against a field data collected during a monitoring campaign of a vineyard located in Montecarlo di Lucca (Italy) The results of the application of the model here described have been retained so far acceptable to predict the following vineyard parameters:
-
Leaf area and temperature
-
Vegetative and fruit mass
-
Sugar berry content
The results obtained by the model using the monitored vineyard show an accuracy ranging among 15% and 20% in evaluating the above-mentioned parameters (Fig. 4 and Fig. 5). Due to limited data recorded, the assessment of the model will be completed after a second field campaign in 2018.
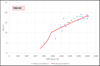 |
Fig. 4 Accuracy in brix calculation (Cabernet) |
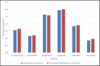 |
Fig. 5 Leaf Area Model Results |
3 Conclusions
The model developed allow to simulate the main parameters related to vine and grapevine growing with sufficient accuracy to be used to identify the impact of meteorological changes in the grapevine and finally wine quality. The feedback of water and nutrient balance, as well as the impact of proper calculation of leaf temperature into the source-sink model for organic matter increment show an interesting accuracy in predictions, as shown by comparison with measured data of both vine leaf area and fruit mass. Since the model is however based on some cultivar-related parameters, a wider test on different sites and cultivar is required, to generalize some of the results so far achieved.
References
- B. Wermelinger, J. Baumgartner, A.P. Gutierrez, Ecol Model, 53, 1–26 (1991) [CrossRef] [Google Scholar]
- A. Deloire, A. Carbonneau, Z.P. Wang, H.J., H. Ojeda, J Int Sci Vigne Vin 38 (1), 1–13 (2004) [Google Scholar]
- S. Poni, M. Gatti, A. Palliotti, Z. Dai, E. Duchêne, T.T. Truong, G. Ferrara, A.M.S. Matarrese, A. Gallota, A. Bellincontro, F. Mencarelli, S. Tombesi, Hortic. 234, 445–462 (2018) [Google Scholar]
- H. Fraga, J.A. Santos, A.C. Malheiro, A.A. Oliveira, J. Moutinho-Pereira, G.V. Jones, Int J Climatol 36, 1–12 (2016) [Google Scholar]
- V. Faluomi, Fifth International Congress on Mountain and steep slope viticulture Conegliano (Treviso − Veneto) − Italy, (2017) [Google Scholar]
- T.M. DeJong, Y.L. Grossman, HortSci 29, 1435-1442, (1994) [CrossRef] [Google Scholar]
- G. Fila, B. Di Lena, M. Gardiman, P. Storchi, D. Tomasi, O. Silverstroni, A. Pitacco, Agric For Meteorol 160, 69–79 (2012) [Google Scholar]
- M. Bindi, F. Miglietta, B. Gozzini, S. Orlandini, F. Seghi, Vitis 36 (2), 67–71 (1997) [Google Scholar]
- Z.W. Dai, P. Vivin, T. Robert, S. Milin, S.H. Li, M. Génard, Funct Plant Biol 36, 527–540 (2009) [Google Scholar]
- P. Vivin, M. Castelan, J.P. Gaudillère, Acta Hortic. 584, 43–56 (2002) [Google Scholar]
- A.N. Lakso, S. Poni, Proc. XIV GiESCO Symposium. 478–484 (2005) [Google Scholar]
- Poni, S., Palliotti, A., Bernizonni, F., J. Am. Soc. Hort. Sci. 131 (2), 273–283 (2006) [CrossRef] [Google Scholar]
- G. Cola, L. Mariani, F. Salinari, S. Civardi, F. Bernizzoni, M. Gatti, S. Poni, Agr Forest Meteorol 184, 117–136 (2014) [CrossRef] [Google Scholar]
- A. Parker, et al, Agr Forest Meteorol, 180, 249–264 (2013) [CrossRef] [Google Scholar]
- A.J. Winkler, General viticulture, University of California Press. ISBN 0520025911 (1974) [Google Scholar]
- J.P. Lhomme, Hydrol Earth Syst Sc 2, 31–40 (1998) [CrossRef] [Google Scholar]
- WEEP Model, Chapter 5 (1995) [Google Scholar]
- Y. Guo, http://lib.dr.iastate.edu/rtd/9994 (1992) [Google Scholar]
- Q. de Jong van Lier, J. C. van Dam, A. Durigon, M. A. dos Santos, K. Metselaar, Vadose Zone J. doi:10.2136/vzj2013.02.0039 (2013) [Google Scholar]
- I. Braud, A.C. Dantas-Antonino, M. Vauclin, J.L. Thony, P. Ruelle, J Hydrol 166 (3-4), 213–250 (1995) [CrossRef] [Google Scholar]
- P.C. Tabares-Velasco, J. Srebric, Build Environ 49, 310–323 (2012) [Google Scholar]
- H. Lambers, F. Chapin III I. Stuart, Pons, L. Thijs, Plant Physiological Ecology (Ed. Springer, 2008) [Google Scholar]
- T.R. Sinclair, R.C. Muchow, Crop Sci 29, 90–98 (1989) [Google Scholar]
- J. D. Scharwies, School of Agriculture, Food and Wine (The University of Adelaide, 2013) [Google Scholar]
- An.N. Sharpley, J.R. Williams, EPIC - Erosion/Productivity Impact Calculator (USDA, 1990) [Google Scholar]
- B. Wermelinger, W. Koblet, Vitis, 29(1), 15–26 (1990). [Google Scholar]
- R. Boulton, Am J Enol Vitic 31, 76–80 (1980) [Google Scholar]
All Figures
|
Fig. 1 Berry sugar accumulation trend (2016) |
| In the text | |
|
Fig. 2 Berry pH trend (2017) Berry |
| In the text | |
|
Fig. 3 Model Structure |
| In the text | |
|
Fig. 4 Accuracy in brix calculation (Cabernet) |
| In the text | |
|
Fig. 5 Leaf Area Model Results |
| In the text | |
Current usage metrics show cumulative count of Article Views (full-text article views including HTML views, PDF and ePub downloads, according to the available data) and Abstracts Views on Vision4Press platform.
Data correspond to usage on the plateform after 2015. The current usage metrics is available 48-96 hours after online publication and is updated daily on week days.
Initial download of the metrics may take a while.