| Issue |
BIO Web Conf.
Volume 17, 2020
International Scientific-Practical Conference “Agriculture and Food Security: Technology, Innovation, Markets, Human Resources” (FIES 2019)
|
|
|---|---|---|
| Article Number | 00142 | |
| Number of page(s) | 7 | |
| DOI | https://doi.org/10.1051/bioconf/20201700142 | |
| Published online | 28 February 2020 | |
Intellectual analysis of spectral images of plants
1
Kuban state agrarian University named after I. T. Trubilin, 350004 Krasnodar, Russia
2
Adyghe State University, 385000 Maykop, Russia
* Corresponding author: This email address is being protected from spambots. You need JavaScript enabled to view it.
Abstract
Traditionally, the assessment of plants for different diseases is carried out by visual determination of leaf damage with the help of an expert – phytopathologist. This method has a number of disadvantages that are proposed to be overcome with the use of the automated system-cognitive analysis (ASC-analysis) of the spectra of images plants in the intelligent system called “Eidos”. For this purpose, we solve the following tasks: Task 1: formulating the idea and concept of the solution of the problem; Task 2: justifying the choice of the method and the tool to solve problems; Task 3: applying the selected method and the tool to solve the problems, i.e. to perform the following steps: – cognitive structuring of the subject area; – formalization of the subject area; – synthesis and verification of models; – improving the quality of the model and the choice of the most reliable models – solution in the most reliable model of diagnostic tasks (classification, recognition, identification), decision support and research of the modeled subject area by studying its model. Task 4: describing the effectiveness of the proposed solution. Task 5: examining the limitations and disadvantages of the proposed solutions for the problems and prospects of its development by overcoming those limitations and drawbacks. We also provide a detailed numerical example intellectual analysis of spectral images of plants with real data by applying the ASC-analysis and “Eidos” intellectual system. However, students and scientists still do not notice that open, scalable, interactive, intelligent online environment for learning and researches already exists and operates, based on automated systemcognitive analysis (ASC-analysis) and its programmatic Toolkit – intellectual “Eidos” and the author’s website. This article is an original presentation and it is designed to familiarize potential users with the capabilities of this environment.
© The Authors, published by EDP Sciences, 2020
 This is an Open Access article distributed under the terms of the Creative Commons Attribution License 4.0, which permits unrestricted use, distribution, and reproduction in any medium, provided the original work is properly cited.
1 Introduction
Traditionally, the degree of damage of plants by various diseases can be estimated using visual determination with the help of an expert in Phytopathology [1–20]. This method is characterized by a number of disadvantages:
High complexity (high costs of labour and time for measurement).
Low accuracy:
due to the use of the ordinal scale, which includes only 5 grades (interval values), the boundaries of which are quantitatively defined;
due to the human factor, i.e. explicit subjective errors in determining the extent of the damage, which leads to an unacceptably strong dependence of the evaluation results not only from the extent of damage the leaves, but also from the experience of the expert;
The lack of adaptability, i.e. the possibility of selfimprovement of traditional methods with the aim to overcome the above mentioned disadvantages and to find zones and configuration for different types of damages (diseases), races of pathogens, plant variety, etc.
We see that the shortcomings of the traditional solutions are quite significant, and, therefore, the efforts of researchers and developers to overcome them are relevant.
Therefore, the aim of this work is to develop a method and instrumentation that provides quantitative rapid assessment of the degree of destruction of plants in the conditions of the field using their images.
To achieve this goal, it is necessary to solve the following problem [25]:
Task 1: to formulate the idea and the concept to solve the problem;
Task 2: to justify the choice of methods and tools to solve the problem;
Task 3: to apply the selected method and the tool to solve the problem, i.e. to perform the following steps:
Cognitive structuring of the subject area;
Formalization of the subject area;
Synthesis and verification of the model;
Improving the quality of the model and the choice of the most reliable model
Performing diagnostic tasks (classification, recognition, identification) in the most reliable model, decision support and research of the modeled subject area by studying its model.
Task 4: to describe the effectiveness of the proposed solution.
Task 5: to examine the limitations and disadvantages of the proposed solutions for the problems and prospects of its development by overcoming those limitations and drawbacks.
Next, we consider the solution of these problems.
2 Materials and methods
2.1 The idea and the concept of the solution of the problem (task 1)
The idea of solving problems is to use modern technologies for this, which simply did not exist during the development of the traditional approach.
Recently, these technologies are increasingly used in various fields of agriculture, such as precision agriculture, survey of agricultural lands on the basis of multispectral image acquisition and analysis; drones are used in environmental monitoring, in the assessment of dynamics of exogenous geological processes, in the inventory of objects of forestry, in the evaluation of the volumes of deforestation, in monitoring of agricultural land, etc. There are virtual instruments for determining leaf area, definition of the contours of grape leaves [21], and the analysis of the contours of insect species [22].
The concept of the solution of the problem formulated above concretizes our idea. It is applying artificial intelligence technologies to create a mobile tool for Phytopathology specialists for quantitative rapid assessment the extent of damage leaves of winter barley due to leaf spot in field conditions, based on spectral analysis of the images of the leaves.
As a virtual tool, it is proposed to use a Windows tablet, allowing running any software under Windows OS and having a camera to obtain quality (high-resolution and good color depth) images of leaves in terms of fieldwork, as well as providing access to the Internet.
If the area of the field where the expert needs to perform his measures has an Internet access, the tablet can be used as a camera for shooting the leaves and transferring their images onto your main computer and as a terminal for remote control for the main computer using TeamViewer. This program provides a comfortable work on a remote computer from your mobile device.
If the area has no Internet access, the tablet provides running the necessary software locally.
Artificial intelligence system that provides spectral analysis of specific images and the formation of generalized spectra of groups of images (classes) can be applied to:
create models that reflect the dependence of the spectral characteristics of leaves of winter barley from the level of their damage caused by leaf spot;
apply these models to diagnose the extent of damage of specific leaves.
According to the hypothesis of the authors, this will ensure overcoming all the above drawbacks of the traditional approach:
It will decrease the cost of labor and time for measurement.
It will increase the measurement accuracy due to:
the use of numerical scales of measurement with any desired number of interval values of the spectrum (numerical experiments were conducted with a number of colors in the spectrum from 7 to 350);
excluding the human factor, i.e. the subjective error in determining the extent of the damage that will provide the dependence of the assessment results only from the degree of destruction of barley and relieve the dependency on the experience of the specialist;
It will ensure adaptability of the measuring instrument due to the possibility of self-improvement for both its zoning and configuration on different types of damage (diseases) and varieties of barley, and for other plants. This will let us create, expand and improve the database for decision-making (models) tailored to the needs of a specific user (or expert).
2.2 The rationale for selecting the method and the tool to solve problems (task 2)
Automated system-cognitive analysis (ASC-analysis) developed by Professor E.V. Lutsenko in 2002 for solving a wide class of problems of identification, forecasting, classification, diagnosis, decision support and research of the modeled subject area by studying its model. ASC-analysis has a software tool, which is a universal cognitive analytical system called “Eidos” (Eidos system).
The system is full free open software and can be accessed on the author’s website at: http://lc.kubagro.ru/aidos/_Aidos-X.htm and implemented in a generic setting, independent from the subject area. The system has about 30 built-in local training applications and about 100 cloud-based Eidos applications of educational and scientific character.
Mathematical model of Eidos system is based on the system fuzzy interval mathematics and provides comparable handling of large volumes of fragmented, noisy and interdependent data in different types of scales (nominal, ordinal, and numerical) and different units of measurement. The system provides creation of information and measuring systems in various application domains [21], in particular, ASC-analysis of images [21, 22]. In Eidos there is implemented software interface for automated input of images into the system and identification for spectral characteristics, such as specific images, and generalized images of the classes, i. e. generalized images based on a few specific ones [23]. This would allow us:
Measuring the spectra of the graphical objects (i.e., determining the colors present in the image).
Forming the generalized spectra classes. It calculates the amount of information in every color of the spectrum of a generalized class of belonging of a particular object with that color in the spectrum to the class.
Comparing concrete objects to classes according to their spectra. We calculate the total amount of information in the colors of the spectrum of a particular object that it belongs to the generalized image class.
Comparing classes with each other in their spectra.
As the image spectrum of the system, we consider the proportion of pixels of different colors in the total number of pixels in the image excluding background.
By multivariable typing, the system creates a systemic cognitive model, using which (if the model is sufficiently accurate), one can solve problems of system identification, prediction, classification, decision support and research of the modeled object by studying its model [21, 24, 25].
All this explains the choice of ASC-analysis and Eidos system as the instruments of solving this problem.
2.3 Applying the selected method and the tool for solving the task 3
The solution of the task 3 involves the following steps, standard for ASC-analysis:
Cognitive structuring of the subject area;
Formalization of the subject area;
Synthesis and verification of models;
Improving the quality of the model and the choice of the most reliable models
Solving diagnostic tasks in the most reliable model (classification, recognition and identification), decision support and research of the modeled subject area by studying its model.
All of these ASC-analysis steps, with the exception of the first one, have been automated in Eidos system. Let us consider them in order of execution.
2.3.1 Cognitive-targeted structuring of the subject area
At the stage of cognitive-targeted structuring of the subject area, we decide on the quality level what we should consider as factors acting on the simulated object (causes), and what will be the results of these factors (effects).
In this article, based on the optical spectra of leaves of winter barley, we are going to determine the degree of lesions of this leaves by leaf spot.
Accordingly, for formalizing the tasks performed in the next step of ASC-analysis, we are going to use two scales:
Classification scale: “The degree of damage caused by leaf spot (%)”;
Share of colors of the optical spectrum in the image of the leaves.
2.3.2 Formalization of the subject area and description of the source data
Formalization of the subject area is the stage of ASC-analysis, which first develops the classification and descriptive dials and graduations, and then uses them to encode the source data to a form, which is convenient for further processing in Eidos system, i.e. for the synthesis and verification of models; it means we form the training sample and the base events.
This is a convenient form of data presentation for system data processing and it is called “normalized database”, and the content of formalization of the subject area, in fact, is a normalization of the source database.
In Eidos system there is a lot of software interfaces with external data sources that can be combined in three groups:
Interfaces with text data;
Interfaces with tabular data;
Interfaces with graphical data.
In the future, we plan to expand the data types for the programming interfaces.
For the convenience of users, using some of the interfaces with graphical data is duplicated in subsystems: 4.7. ASC-analysis of images and 4.8. Geocognition system.
As the image spectrum in the system, we consider the proportion of pixels of different colors in the total number of pixels in the image excluding the background [23].
This mode has provided:
the image input into system according to the pixels (to do this, we execute the first two modes of the training data);
measurement of the spectra of images with a given number of color ranges (color ranges) (4th mode of data preparation);
a review of the characteristics of the spectrum of certain images as their characteristics in the formation of models (along with the pixels);
an output of the original images with their spectra on the screen and saving them as files in the folder: ..\AID_DATA\InpSpectrPix\.
the formation of the generalized spectra of images belonging to different groups, classes (generalized spectra classes);
a quantitative comparison of specific images by their generalized spectra with spectra of the classes, i.e. the solution to the identification problem (classification, diagnostics, recognition, forecasting);
quantitative comparison of the spectra of generalized classes to each other and solving the problems of cluster and structural analysis;
The source image must be in jpg or bmp format, and must be directly in the folder: ../Aid_data/Inp_data/, if the aim is formalization of the subject area and the synthesis model, and in the folder: ../Aid_data/Inp_rasp/, if the aim is formation of a detectable sample.
For spectral analysis of images no matter how they are scaled and rotated, but it is desirable that they were without any background. Batch on-line services, provide “contouring and removing the background” of images are possible to find in the Internet upon the request quoted.
The system works with image files with .jpg and .bmp extensions. Files better had no more than 400 pixels horizontally and vertically, otherwise they may appear on the screen in-correctly and the processing time can be very lengthy, because there is a pixel-by-pixel analysis of the image files.
The part of the file name before the dash is considered by Eidos system as the name of the class, i.e. the group to which the file belongs.
After the dash, there is an internal file numbering within the class, i.e. the number of implementation or monitoring.
For example, a generalized image class called: “barley 00%” will be generated by the sys-tem based on the 6 examples of leaves attributable to this class, and the image class called: “barley 15%” – only based on 2 examples. If the dash in the file name is missing, the whole file name would be treated as the class name.
Let us pay attention to the fact that Eidos system sorts text gradation of the classification scales, i.e. classes, in alphabetical order. Therefore, to keep a correct order and the scale ordinal, not just nominal, in the names of the graphic files of the source data we use leading zeros when numbering implementations inside the class (09 instead of 9, 01 instead of 1). The number of such leading zeros is taken in order to have enough to number all the files.
Due to the formalization of the subject area, we get all the conditions for the synthesis and verification (assessment of reliability) of models.
2.3.3 Synthesis and verification of statistical and system-cognitive models
Synthesis models
The synthesis and verification of the models are carried out in the 3.5 mode of Eidos. The stage of the application process and the time of completion estimation appear on the screen.
Model verification
The evaluation of the reliability of the models is carried out by solving the problem of classification of the source images according to the images of the classes and counting the number of true positive and negative, as well as false positive and negative solutions in F-measure by van Rijsbergen and L1-L2-measures by Professor E. V. Lutsenko [23].
Classic quantitative measure of the reliability of the models: F-measure by van Rijsbergen is based on counting the total number of correctly and incorrectly classified and not classified objects in the training sample. In multiclass classification systems, the object can simultaneously apply to multiple classes. Accordingly, in the synthesis of the model its description can be used for the formation of generalized images of many of the classes it belongs to. When using the model for classification, we determine the degree of similarity or divergence of the object with all the classes, and a true-positive solution may be the membership of the object in several classes. As a result of this classification, it turns out that the object is not just correctly or wrongly relates or does not relate to different classes, both in the classical F-measure, but correctly or wrongly relates or does not relate to them in varying degrees.
However, the classic F-measure does not account for the fact that the object may simultaneously belong, in fact, to multiple classes (multicrossover) and the fact that the result of the classification can be a different degree of similarity-differences of object classes (blur-ring). In the numerical example, the authors state that with truepositive and true-negative solutions, the similarities-differences of the object class module is much higher than for false positive and false negative solutions.
Therefore, it was proposed to use L1-measure of the reliability of the models [23], taking into account not just the fact of true or false positive or negative solutions, but also the degree of confidence of the classifier in these solutions. In classifying big data, we have revealed a large number of false-positive decisions with a low level of similarity, which, however, in total, contribute to reducing the reliability of the model.
In order to overcome this problem, we propose using L2-measure (Lutsenko, 2017), which uses the average similarity by different classifications instead of the sum of the levels of similarity. Thus, this work offers measures of the reliability of the models, called L1- measure and L2-measure, mitigating and overcoming the shortcomings of the F-measure; these measures are described mathematically and their application is demonstrated on a simple numerical example. In Eidos intellectual system, which is a software toolkit for the automated system-cognitive analysis (ASC-analysis), all these measures of the reliability of the models: F, L1 and L2 have been implemented.
Mode 4.1.3.6 shows the accuracy of each model according to these measures of reliability. In this case, INF3 model has the highest accuracy according to L2-measure.
3 Results
3.1 Diagnosis of the extent of the damage caused by leaf spot in barley
3.1.1 The spectra of the original images
The spectra of source images are formed at formalization of the subject area, because they represent one of the stages of the process of formalization. However, they are presented in this section (Figure 1), because it is easier to compare them with generalized spectra of the classes, which are formed at the synthesis stage of the model, and which will be considered in the next section.
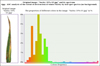 |
Fig. 1. Examples of spectra of original images of barley leaves affected by net blotch in varying degrees |
3.1.2 Generalized spectra classes
The spectra of the original images shown in Figure 1, show that the higher the degree of damage caused by leaf spot is, the smaller the share of green and the bigger the share of red are. Nevertheless, it is evident on a qualitative level. The quantitative comparison carried out in the system by forming the generalized spectra of classes that were compared to each other (Figure 2).
From Figure 2 we can understand how they performed a comparison of the generalized spectra of classes with each other. On the left, we see the relative frequency, i.e., roughly speaking, the conditional probability of colors of the optical spectrum in each class (it is indicated by the height of column colors in the histogram) and the average for the whole sample of the source images, i.e. the prior probability (indicated by dashed lines).
It can be easily seen, that in each class some colors are more common than the average for the sample, and some are less common.
The image on the right shows the result of the comparison of the conditional spectrum class with the absolute spectrum of the whole sample. For each color of the spectrum, the result of the comparison includes the sign and the module.
If the probability of the color in the class is higher than the average for the whole sample, we see the corresponding color spectrum in the form of a column greater than zero.
If the probability of the color in the class is lower than the average for the whole sample, we see the corresponding color spectrum in a column below zero.
The module column of each color reflects the degree of difference between the conditional probability of meeting that color in a given class from the unconditional probability of its meeting for the whole sample.
Positive colors on the image on the right can be considered typical for this class, and negative ones are not typical, the degree of difference from zero reflects the degree of specificity or non-specificity.
From comparison of the spectra of the generalized classes, we know that the lower the degree of damage caused by leaf spot is, the more typical the green color of the leaves is and the less common red is; the higher the degree of damage is, the higher the specificity of the red color is, and the lower the specificity of the green is.
On the right, we see the data of the color of each spectral range, which tells us about the place of the object with that color in a particular class. If in a given class the conditional probability to find pixels of this color is higher than the unconditional probability of meeting the average for the whole sample, this spectral range is typical for this class, if lower than for the whole sample – that is not typical, if the conditional probability of meeting the pixels in this spectral range is close to the unconditional (average for the whole sample), the detection of the color of a particular image says nothing about belonging or not belonging of the given image to this class.
According to the obtained results, it is clear that the program is clearly delineate the leaves on different percentages of lesions (due to the colors met), yet it determines the probability of meeting the color of the class studied; stores it in the database, after which, you can download tens and hundreds of scanned leaves, and the program would accurately and quickly refer to a particular class of lesions, which greatly accelerates and facilitates the process for researchers.
When there is a large study sample, in the future, it will be possible to create a database for each variety and disease, and to analyze the resilience or susceptibility of the varieties in different agro-climatic conditions in the years of research and even in the races of pathogens.
In essence, this means that the system called “Eidos” to a certain extent computerizes those methods of the analysis which are applied by an expert in Phytopathology and significantly improves the quality of his work and reduces its complexity.
Quantitative estimations of these parameters are based on analytical expressions for individual criteria, based on which, a calculated in Eidos model appears.
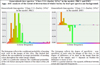 |
Fig. 2. Example of a generalized spectrum of a class of images of barley leaves, with a certain degree of damage caused by leaf spot |
3.1.3 Screen forms with the results of diagnostics
To perform diagnostics, i.e. for determination of the degree of similarity in specific leaf images with generalized classes according to their spectra, it is necessary to perform routine 4.1.2 in the most reliable INF3 model, which had been made current previously. The diagnostic results can be output in many screen forms and tables that are grouped in the mode 4.1.3. The recognition results output.
3.1.4 Studying the simulated subject area through the examination of its models
Eidos system includes many different possibilities for studying the simulated object by examining its model. Naturally, the results of these studies can be considered as the results of the study of the object of modeling to the extent that the model correctly reflects its properties, because it is adequate.
In particular, this includes the following studies: information portraits of the classes; non-local neurons and a neural network; cluster-constructive analysis; automated SWOT-analysis; cognitive function and several others. However, this article not even briefly considers these tools of scientific research in connection with the severe restriction on its volume.
3.2 Insights
3.2.1 The effectiveness of the proposed solution to the problem (task 4)
As the analysis of the results of the numerical experiment shows, problem solving proposed and implemented in the system of “Eidos” is quite effective, and it can reasonably claim that the purpose of the work is achieved.
3.2.2 The limitations and disadvantages of the proposed solution to the problem and the prospects for its development by overcoming these limitations and drawbacks (task 5)
However, it was discovered that some classes were not related to the clusters they were expected to be.
For example, as it can be seen from the cognitive chart, the class of 30% of the lesions was in the cluster: “Low degree of damage”, and classes 15% and 20% were in the cluster: “High degree of damage”. The reasons for this are seen in certain incorrectness of the selection of the source data, as well as in its evaluation by experts. To overcome this drawback we recommend:
To increase the volume of the source data;
To valuate data using a group of experts;
To reduce the number of levels in the classification scale;
To use a specially designed classification scale.
However, this is planned to be done in future work.
4 Conclusion
As the result of this work, using Eidos system, we have measured spectra of graphic images of barley leaves of Pavel variety damaged by leaf spot (i.e., we have precisely defined the colors present in the image); we have formed the generalized spectra of classes. We have also compared particular objects to classes according to their spectra. The total amount of information in the colors of the spectrum of a particular object to find if it belongs to the generalized image of the class was calculated.
Thus, the goals and the aim have been achieved, the problem has been solved.
Acknowledgement
The authors express their gratitude to I. L. Astapchuk (http://ej.kubagro.ru/a/viewaut.asp?id=6179) for the kind provision of real empirical data for the numerical experiment.
References
- O.S. Afanasenko, Methodological guidelines on the diagnosis and methods of field assessment of the resistance of barley to leaf pathogens 20 (1987) [Google Scholar]
- O.S. Afanasenko, Diagnosis of gelmintosporioz spots of barley leaves Agro XXI 3, 10–11 (1997) [Google Scholar]
- O.S. Afanasenko et al., Stability of zoned and promising for zoning barley and wheat varieties to leaf diseases in the State variety plots (SVP) in the North-West region of the Russian Federation. Technology of the creation and use of varieties and hybrids with group and complex resistance to harmful organisms in plant protection 199–211 (2010) [Google Scholar]
- L. Babayants, A. Meshterhazi, F. Wachter, N. Nekles et al., Methods of breeding and assessing the resistance of wheat and barley to diseases in the CEMA-member countries 270–277 (1988) [Google Scholar]
- Yu.T. Dyakov, Yu.V Sergeeva, New in the systematics and nomenclature of mushrooms 496 (2003) [Google Scholar]
- A.A. Zhuchenko, Adaptive system of plant breeding (ecological and genetic basis) Monograph in 2 volumes, vol. 2, 780 (2001) [Google Scholar]
- T.I. Ishkova, A.E. Chumakov, Diseases of grains and cereals 21–38 (2005) [Google Scholar]
- L.A. Kashemirova, Phytosanitary diagnostic systems for protecting the spring barley from dark brown and netted “gelmintosporiosis” PhD dissertation thesis, 33 (1995) [Google Scholar]
- I.Yu. Kushnirenko, Mesh spotting of barley in the southern Urals and the source material for the creation of disease-resistant varieties PhD dissertation thesis, 19 (1987) [Google Scholar]
- O.A. Saladunova et al., Forecast of the phytosanitary state of crops in Moscow Region for 2011 87 (2011) [Google Scholar]
- B.A. Khasanov, Imperfect fungi as causative agents of major cereal diseases in Central Asia and Kazakhstan PhD dissertation thesis, 44 (1992) [Google Scholar]
- V.M. Shevtsov, Selection and agrotechnology of winter barley in Kuban Region 137 (2008) [Google Scholar]
- T. G. Fetch, Jr.B. J. Steffenson, Rating scales for assessing infection responses of barley infected with Cochliobolus sativus Plant Dis. 83, 213–217 (1999) [CrossRef] [PubMed] [Google Scholar]
- K.W. Jayasena et al., Yield reduction in barley in relation to spot-type net blotch Austr. Plant Pathol. 36, 429–433 (2007) [CrossRef] [Google Scholar]
- T.N. Khan, Effect of spot-type net blotch (Drechslera teres (Sacc.) Shoem) infection on barley yield in short season environment of northern cereal belt of Western Australia Austr. J. Agric. Res. 40, 745–752 (1989) [CrossRef] [Google Scholar]
- G.M. Murray, J.P. Brennan, Estimating disease losses to the Australian barley industry Austr. Plant Pathol. 39(1), 85–96 (2009) [CrossRef] [Google Scholar]
- V. Smedegard-Petersen, Isolation of two toxins produced by Pyrenophora teres and their significance in disease development of 164 net-spot blotch of barley Physiol. Plant Pathol. 10, 203–208 (1977) [CrossRef] [Google Scholar]
- A. Tekauz, M. Desjardins, Re-emergence of spotted net blotch in Manitoba Can. J. Plant Pathol. 33, 293 (2011) [Google Scholar]
- Syngenta Global, Retrieved from: www3.syngenta.com [Google Scholar]
- I.L. Astapchuk, Mobile tools of a phytopathologist for quantitative fast assessment of winter barley leaves damage with barley blotch in field conditions based on spectral ASC-analysis and “Eidos” system Scientific J. of KubSAU 7(131), 325–386 (2017) [Google Scholar]
- E.V. Lutsenko, V.N. Laptev, A.E. Sergeev, Systemcognitive modeling in agro-industrial complex (AIC), tutorial 518 (2018) [Google Scholar]
- E.V. Lutsenko, Adaptive synthesis of intelligent measurement systems with the use of ASC-analysis and “Eidos” system. System identification in econometrics, biometrics, ecology, pedagogy, psychology and medicine, Sci. J. of KubSAU, 2(116), 1–60 (2016) [Google Scholar]
- E.V. Lutsenko, Automated system-cognitive analysis of specific spectral and integrated images in “Eidos” system (application of information theory and cognitive technologies in spectral analysis) Sci. J. of KubSAU 4(128), 1–64 (2017) [Google Scholar]
- E.V. Lutsenko, V.E. Korzhakov, V.V. Ermolenko, Intellectual systems in controlling and management of medium and small firms, under the scientific 392 (2011) [Google Scholar]
- E.V. Lutsenko, V.I. Loiko, Semantic information models for the management of the agro-industrial complex 480 (2005) [Google Scholar]
All Figures
|
Fig. 1. Examples of spectra of original images of barley leaves affected by net blotch in varying degrees |
| In the text | |
|
Fig. 2. Example of a generalized spectrum of a class of images of barley leaves, with a certain degree of damage caused by leaf spot |
| In the text | |
Current usage metrics show cumulative count of Article Views (full-text article views including HTML views, PDF and ePub downloads, according to the available data) and Abstracts Views on Vision4Press platform.
Data correspond to usage on the plateform after 2015. The current usage metrics is available 48-96 hours after online publication and is updated daily on week days.
Initial download of the metrics may take a while.