| Issue |
BIO Web Conf.
Volume 17, 2020
International Scientific-Practical Conference “Agriculture and Food Security: Technology, Innovation, Markets, Human Resources” (FIES 2019)
|
|
|---|---|---|
| Article Number | 00236 | |
| Number of page(s) | 5 | |
| DOI | https://doi.org/10.1051/bioconf/20201700236 | |
| Published online | 28 February 2020 | |
Economic aspects of fruit production: a case study in Poland
1
Wroclaw University of Economics, Department of Financial Accounting and Control, 53-345 Wroclaw, Poland
2
Samara State Agrarian University, Department of Economic Theory and Economics of AIC, 446442 Kinel, Samara region, Russia
* Corresponding author: This email address is being protected from spambots. You need JavaScript enabled to view it.
Abstract
The article discusses the economics of fruit growing in Poland. Poland currently holds leading positions in the cultivation of apples, cherries, raspberries, currants, gooseberries, blueberries, strawberries and mountain ash. In 2017, the area of fruit growing in Poland amounted to 390 570 thousand ha. In this regard, the problem of efficiency arises. The authors analyze the cost structure of apple production as the most important horticultural culture in Poland.
© The Authors, published by EDP Sciences, 2020
 This is an Open Access article distributed under the terms of the Creative Commons Attribution License 4.0, which permits unrestricted use, distribution, and reproduction in any medium, provided the original work is properly cited.
1 Introduction
In the last few years, the costs of production of various fruit species have been intensively analyzed in the world, for example in India, e.g. for pears [10] and other fruit crops [11], analysis of the costs of irrigation of the main crops on the west coast of the United States [15], in China e.g. for apples [18].
Kaur and Sachdeva (2018) analyzed the cost structure, returns and efficiency of pear cultivation in Punjab [10]. The results indicated that the expenditure on plant materials and planting costs have the largest share (20.40 per cent) during the establishment of pear orchards followed by digging and filling of pits (20.40 per cent). The annual operational/maintenance cost was low in the initial years, consistently increased during the subsequent years with the increase in the age of the orchard. Manures and fertilizers, intercultural operations, plant protection measures and training and pruning were the major components of operational cost [17]. Kaur, Singh and Kumar (2016) also showed that the annual operational/maintenance cost was low in the initial years, which consistently increased with the increase in age of the orchard [11]. Plant protection measures, pruning, maturing/fertilization and watch and ward were the major components of operational cost.
Feinerman, Eli and Tsur, Yacov, (2014) conducted research on the costs of water reuse in Israel and Senol, Ramazan conducted research on the costs of maintaining irrigation systems in Turkey (2012) [6, 19]. Feinerman and Tsur concluded that perennial crops require substantial, initial investment followed by a gestation period of a number of years during which the crop does not produce harvestable yield [6]. As a result, the cycle duration of a perennial crop (from planting to felling) must be long enough for the crop to cover the investment cost and become profitable. The problem of finding the optimal cycle duration becomes involved when the cycle may be interrupted by stochastic events. Investigating the profitability of perennial crops under uncertain cycle duration induced by stochastic water regime (uncertain drought events), they show how the distribution of drought events induces a distribution on the cycle duration and, in turn, on the expected net present value (EV) of repeated crop cycles [20]. The analysis is applied to perennial crops grown in northern Israel and presents sensitivity to the drought hazard parameter and other weather and crop parameters.
In 2005, Mouron, Patrik also dealt with orchard portfolio management systems; Scholz, Roland W.; Nemecek, Thomas; et al. (2006) [14].The main result was that environmental impacts such as ecotoxicity, eutrophication and non-renewable energy use did not necessarily increase when farms increased their income. A higher input level of pesticides, fertilisers and machinery did not lead to increased yields and receipts.
Beau Olen, JunJie Wu, Christian Langpap (2016) find that economic and physical water scarcity, climate, and extreme weather, such as frost, extreme heat, and drought, significantly impact producers’ irrigation decisions [15]. Producers use sprinkler technologies or additional water applications to mitigate risk of crop damage from extreme weather. The analysis provides information about how producers in irrigated agricultural production systems would respond and adapt to water pricing policies and climate change.
The study of Wang, Huo and Kabir (2013) explore that the inefficient production of apple farmers is caused primarily by two aspects [18]. One aspect is the inefficient apple orchards operation of the farmers themselves. The other one is the disadvantageous environmental conditions which heavily affect apple growth and fruit bearing situation. It is a large space for these technically and economically inefficient areas to improve apple production efficiency.
In the 1990s, the economics of apple production in relation to tree density up to 5000 trees/planted ha at Lincoln University in New Zealand was the subject of research by Cahn and Goedegebure. They study carried out in the Netherlands which investigated the effect of tree density, prices, yields, and interest rates on the economics of apple growing in the Netherlands and identified the economic factors which contributed to the success of high density planting (1992) [5].
In Poland, the Institute of Agricultural and Food Economics, the National Research Institute and its employees, and the Institute of Horticulture have been dealing with the costs and profitability of producing basic fruit species for many years. Kierczynska (2004), Brzozowski (1999) and Zmarlicki (1999) have studied the structure of apple production costs depending on the type of orchard (tree planting density per hectare) [2, 7, 22]. Researchers computed that direct and total costs of apple production were higher in orchards with higher density; however yields determine unit costs [13]. Kierczynska’s research showed that the differences in apple production costs were mainly due to depreciation, which was three times higher in high-density dwarf orchards than in traditional orchards [7]. The cost of fruit production includes direct and indirect costs. Direct costs include material costs (fungicides, zoocides, herbicides, mineral fertilizers, growth and yield regulators, measures to improve fruit storage properties) labor costs, costs of own machinery and tractors as well as costs of external services. The indirect costs include the costs of maintaining machines and tractors as well as general costs. The costs of maintaining machines and tractors included depreciation, storage (garage and maintenance) and insurance. General costs related to maintaining production and commercial readiness of the farm. The analysis of the structure of total costs of apple production indicates that nearly 20% of the total costs of apple production are material costs, and 20–28% – labor costs. However, the share of depreciation in the cost structure of individual types of orchards was more diverse. In traditional orchards it constituted 15%, and in dwarf orchards from 21 to 30%.
There are also works devoted to the analysis of costs of apple orchard protection and labor costs in orchards in conventional or organic production and integrated fruit production [3, 4]. In conventional production, the most labor-intensive activity is harvest (up to 72% of people’s labor input in the orchard). In organic production, the harvest accounted for 34% of people’s working time.
Krzysztof Pakula, Beata Kuziemska, Joanna Trqbicka. Krystyna Pieniak-Lendzion (2018) also took care of the size and profitability of apple production in Poland [16]. These authors used only research conducted by other researchers, including by Klimek in 2016 and Kierczynska in 2004 [7, 8].
2 Materials and methods
The analysis was based on primary empirical data obtained from the period 2012–2018 from an orchard farm located in the Lower Silesian Voivodship. The farm, with a total area of 33 ha, produces apples and peaches. Plantings account for 90% of the area, 10% is land prepared for new plantings. Peaches are grown on the farm – on 6 ha and apple trees on 24 ha (on M9-18 ha dwarf and M26-dwarf rootstock – 6 ha), the others are meadows. Planting density depends on the type of rootstock used. Apple orchards planted in 1994 at 4.0 m x 2.5 m spacing are 4 ha, the rest are young plantings at 3.5 m and 1.5 m spacing. Peach quarter was established in 2004. The farm in Poland belongs to the least numerous groups of entities with the largest orchard area with perennial crops (0.5% of farms have over 20 ha of fruit from trees, which constitute 20% of the area) [9]. The farm has two buildings, serving as fruit storage and sorting, the so-called controlled atmosphere refrigerators. The first was built in 1982 with an area of 372 m2, the second in 2002 with an area of 780 m2, with a total capacity of 520 tons in KA. The capacity of cold rooms is not sufficient for the harvested harvest. The harvesting season begins in July with the peach harvest, when the cold rooms are empty. Two of the six chambers are used until the middle or end of August for storing peaches. From August, the use of two chambers for storing summer apples begins. In September and October the process of filling all remaining chambers with harvested apples is underway. Depending on the weather conditions, this process can last until the first days of November. The farm is equipped with four tractors and two sprayers (orchard and field).
In the course of the study, the structure of the cost of fruit-growing activities was calculated in 2018. The farm is not obliged by any law to keep records; it is not a VAT payer. The taxpayers of this tax are also not their owners; therefore the cost analysis includes gross amounts, except for one case, together with the tax on goods and services. As the farm did not keep detailed and separate records of production costs incurred for the production of peaches and apples, fruit cultivation was adopted as the production cost reference unit.
3 Results and discussion
Poland is one of the largest fruit producers in Europe. It produces the most in the EU: apples, cherries, raspberries, currants and gooseberries. Poland is also a significant EU producer of blueberries, strawberries and chokeberries. In 2017, the area of fruit growing in Poland amounted to 390,570 thousand ha, including apple trees 176 thousand ha. The share of apple-growing area in the area of all fruit trees in the country was over 72% (Production of agricultural and horticultural crops in 2017, Central Statistical Office of Poland, 2018.) [1].
Two-thirds of the EU’s farms were less than 5 hectares (ha) in size in 2016. At the other end of the production scale, 10.5% of the EU’s farms were of 30 ha or more in size and worked 76.7% of the EU’s utilized agricultural area (UAA). 3.6% of farms have 30-49.9 ha and occupy 8.5%. In most Member States, a majority of UAA was concentrated on the largest farms (50 ha or more in size). So although the average mean size of an agricultural holding in the EU was 16.6 ha in 2016, only about 15% of farms were this size or larger.
About one half (52.5%) of all farms in 2016 could be categorized as being crop specialist farms; just under one third (31.6%) of all farms were specialized in field cropping, about one fifth (18.9%) were specialized in permanent crops, with remainder (1.8%) being specialist horticultural farms. In this grouping of farms, general field cropping farms that specialized in root crops (such as potatoes and sugar beet), in field vegetables and field crops were the most numerous (accounting for 16.4% of all EU farms), but fruit and citrus fruit 5.1%.
Polish horticulture is characterized by a large variety of species and varieties. Production in Poland, including apples, was the result of market factors and structural transformations [21]. The development of production and storage facilities as well as sorting and packaging equipment contributed to increasing the competitiveness of Polish fruit and their products, which enabled the increase of commodity production and the improvement of the commercial offer. There were conditions for farmers to organize into producer groups and organizations. As at September 28, 2018, there were 273 recognized fruit and vegetable producer organizations in Poland, associating 6.7 thousand members, one pre-recognized group of fruit and vegetable producers (with 8 members) and one association of fruit and vegetable producer organizations (with 4 recognized fruit and vegetable producer organizations) KOWR [9].
If fruit growers cannot store the fruit in their own rooms, they put them in the cold rooms of fruit and vegetable producer groups. In Poland, fruit storage uses cold stores with normal atmosphere (NA) and cold stores with controlled atmosphere (KA). The storage room is an insulated object without refrigeration equipment, in which storage conditions are regulated only by exchanging internal and external air. The biggest disadvantage of this technology is the inability to quickly cool the fruit after harvesting due to too high temperature outside the facility; this is the basic condition for maintaining high quality of stored fruit. Fortunately, this technology in fruit-growing practice is no longer significant.
Fruit production costs depend on many factors, depending on weather conditions, adverse weather phenomena, severity of diseases or pests. Each season is different, and the production costs are not comparable due to the maintenance of different varieties, with different rootstocks and on different types of soil on individual farms. In addition, the level of unit costs depends on the productivity achieved on the farm. Difficulties in maintaining the comparability of cost conditions between entities (farms) and the lack of data on the number and power of refrigeration equipment in Poland influenced the applied research method and the appropriate research approach. Case study was used. Table 1 summarizes the costs of operating the orchard. They were grouped into types, i.e. their structure was determined due to the economic content of the cost. The cost of apple production depending on the yield in tones/ha was not analyzed in the study.
The total cost of orchard operations in 2018 was less than 700,000 PLN (696,518 PLN / 30 ha), which gives PLN 23,177.27 per hectare of fruit cultivation or PLN 25796.96 (PLN 696 518/27 ha). It can be assumed that the level of costs is only approximate. For comparison, according to research conducted by G. Klimek, the total costs of running an apple orchard in 2014 and 2015 in Poland averaged about PLN 43,000.00/ha. The researcher points out that the level of production costs will be different at a farm producing industrial fruit compared to the production of dessert fruit. The level of the cost of producing dessert fruit is affected by the share of industrial fruits in the quality structure of production. The share of industrial apples in the qualitative structure of production should be as low as possible. It is assumed that the level of 10 percent for the maximum possible. In Poland, according to G. Klimek, the share of industrial apples in 2004–2014 only once exceeded 20–30 percent (2016) [8].
Cold stores are objects equipped with cooling devices enabling full control of the temperature of stored fruit. Depending on the refrigeration chamber (its gas tightness) and equipment, the fruit can be stored in an atmosphere: normal (containing 21% oxygen and practically 0% carbon dioxide), modified (the sum of oxygen and carbon dioxide concentrations is 21% – the atmosphere with the composition 15–16% oxygen and 6–5% carbon dioxide) and controlled (we can freely determine oxygen and carbon dioxide concentrations).
Depending on the species and variety, the CO2 concentration may range from less than 1% (e.g. for pears and apples of some varieties) to several percent (e.g. cherries, highbush blueberries). The oxygen concentration in the controlled atmosphere is usually from about 1 to 5%.
The initial investment for apples can be high depending on the production method chosen, land preparation, and initial investment in the trees. A commercial orchard is expected to be productive for at least 20 years, so this investment will be spread over a longer period of time than many crops.
In 2018, electricity consumption amounted to PLN 44,232, which represents 6.4% of the cost of the orchard [12]. Electricity consumption in the years 2012 to 2018 is presented in the Figure 1.
Over the period considered, electricity consumption was at a very different level. One can point to a slight increase in electricity consumption, and thus also an increase in fees for this consumption (Figure 2).
The highest electricity consumption in the period considered (the highest demand for electricity) was in 2018 and amounted to over 93 374 kWh. The lowest was in 2013 and reached the level of 57 006 kWh. Changes in electricity consumption also resulted in changes in the amount of fees paid.
There were changes in electricity prices per 1 kWh during the period under review. Unit costs of electricity consumption were determined on the basis of prices paid to the seller and distributor and the amount of electricity consumed in two time zones. Weighted average electricity prices paid for 1 kWh are presented in the Fig. 3.
Energy consumers pay fees for obtaining it in PLN/kWh. The fees include the price of electricity, reflecting the costs of obtaining it, and fees related to transmission and distribution (variable and fixed). Additional fees, i.e. commercial, permanent, transitional and subscription distribution fees are settled in PLN/month.
Weighted average prices are not average annual electricity sales prices on the competitive market, which are set by the President of the Energy Regulatory Office. The average annual electricity sales price on the competitive market in 2018 was 194.30 [PLN/MWh]. These are the prices paid to the seller for the electricity consumed and to the distributor for the service of supplying it. Electricity sale agreement – an agreement concluded with the Seller, specifying mutual rights and obligations related to the sale of electricity to the Customer. Contract for the provision of distribution services – an agreement concluded with the DSO specifying mutual rights and obligations related to the provision of electricity distribution services to the Customer. The first of these was negotiated with the seller throughout the period considered, while the second was not. The lowest prices occurred in 2017, the highest in 2014. The weighted average price from 2018 approached the level of prices in 2012. Despite the increase in electricity consumption costs in 2018, the weighted average price was low due to high kWh consumption.
Structure of the cost of apple production in the orchard in 2018
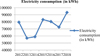 |
Fig. 1. Electricity consumption in 2012–2918 [kWh] |
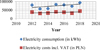 |
Fig. 2. Consumption and costs of electricity in 2012-2018 |
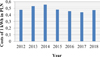 |
Fig. 3. Costs of 1 kWh in PLN in 2012-2018 |
4 Conclusion
Apples may be grown in many parts of the world, but fruit production costs will increase due to the need to insure contractors, watering orchards and high air temperatures. The study was conducted in accordance with the defined research procedure. The obtained results allowed drawing the following conclusions.
Poland is one of the largest fruit producers in Europe. It produces the most in the EU: apples, cherries, raspberries, currants and gooseberries. The share of apple-growing area in the area of all fruit trees in the country was over 72%.
Two-thirds of the EU’s farms were less than 5 hectares (ha) in size in 2016. At the other end of the production scale, 10.5% of the EU’s farms were of 30 ha or more in size and worked 76.7% of the EU’s utilized agricultural area (UAA). 3.6% of farms have 30-49.9 ha and occupy 8.5%.
At September 28, 2018, there were 273 recognized fruit and vegetable producer organizations in Poland, associating 6.7 thousand members, one pre-recognized group of fruit and vegetable producers (with 8 members) and one association of fruit and vegetable producer organizations (with 4 recognized fruit and vegetable producer organizations) KOWR.
The total cost of orchard operations in 2018 was less than 700,000 PLN (696,518 PLN / 30 ha), which gives PLN 23,177.27 per hectare of fruit cultivation or PLN 25796.96 (PLN 696 518/27 ha).
The level of the cost of producing dessert fruit is affected by the share of industrial fruits in the quality structure of production. The share of industrial apples in the qualitative structure of production should be as low as possible. It is assumed that the level of 10 percent.
In 2018, electricity consumption amounted to PLN 44,232, which represents 6.4% of the cost of the orchard.
References
- Eurostat, 2018. Agriculture, forestry and fishery statistics. Retrieved from: https://ec.europa.eu/eurostat/en/web/products-statistical-books/-/KS-FK-18-001 [Google Scholar]
- P. Brzozowski, Gardening, 6-8, 4–99 (1999) [Google Scholar]
- P. Brzozowski, Orchards management in sustainable fruit production, J. Fruit Ornam. Plant Res. 12, 63–68 (2004) [Google Scholar]
- P. Brzozowski, K. Zmarlicki, Annals of Agricult. Econ. and Rural Developm., 101-3, 41 (2014) [Google Scholar]
- M.B. Cahn, J. Goedegebure, New Zealand J. of Crop and Horticult. Sci., 20, 289–296 (1992) [CrossRef] [Google Scholar]
- E. Feinerman, Y. Tsur, Agricult. Econ., 45-6, 757–766 (2014) [CrossRef] [Google Scholar]
- S. Kierczynska, Annals of the Agricultural University in Poznan – CCCLX Horticulture, 38, 83–96 (2004) [Google Scholar]
- G. Klimek, Modern Orchard, 3 (2016) [Google Scholar]
- KOWR, 2018. Fruit market in Poland. Retrieved from: http://www.kowr.gov.pl/uploads/pliki/wydawnictwa/rynek_owocow_kowr_2018.pdf. [Google Scholar]
- K. Kaur, J. Sachdeva, Indian J. of Econ. and Developm., 14-3, 547–552 (2018) [CrossRef] [Google Scholar]
- M. Kaur, J. Singh, S. Kumar, Indian J. of Econ. and Developm., 12-4, 703–710 (2016) [CrossRef] [Google Scholar]
- A. Lakomiak, K. A. Zhichkin, J. of Phys.: Conf. Ser. (JPCS) (2019) (to be published) [Google Scholar]
- E. Makosz, Opportunities and threats to national gardening after accession to the European Union (Agricultural University Publisher, Lublin, 2000) [Google Scholar]
- P. Mouron, R.W. Scholz, T. Nemecek, et. al., Ecolog. Econ., 58-3, 561–578 (2006) [CrossRef] [Google Scholar]
- B. Olen, J.J. Wu, Ch. Langpap, Amer. J. of Agricult. Econ., 98-1, 254–275 (2016) [CrossRef] [Google Scholar]
- K. Pakula, B. Kuziemska, J. Tr^bicka, K. PieniakLendzion, Scientific Notebooks of the Warsaw University of Life Sciences Econ. and Organizat. of Food Econ., 122, 81–93 (2018) [Google Scholar]
- S. Raghav, S. K. Srivastava, Indian J. of Econ. and Developm., 11-4, 815–822 (2015) [CrossRef] [Google Scholar]
- L. Wang, X. Huo, Kabir, Md Shajahan, China Agricult. Econo. Review, 5-3, 391–411 (2013) [CrossRef] [Google Scholar]
- R. Senol, Energy Policy, 47, 478–486 (2012) [Google Scholar]
- K. Zhichkin, V. Nosov, L. Zhichkina, Zh. Dibrova, T. Cherepova, IOP Conf. Ser. Earth Environ. Sci., 315, 022023 (2019) [CrossRef] [Google Scholar]
- K. Zmarlicki, P. Brzozowski, Sci. Annals of the Associat. of Agricultu. and Agribusin. Econ., 16(5), 244–247 (2014) [Google Scholar]
- K. Zmarlicki, Horticult. Password, 5, 22–24 (1999) [Google Scholar]
All Tables
All Figures
|
Fig. 1. Electricity consumption in 2012–2918 [kWh] |
| In the text | |
|
Fig. 2. Consumption and costs of electricity in 2012-2018 |
| In the text | |
|
Fig. 3. Costs of 1 kWh in PLN in 2012-2018 |
| In the text | |
Current usage metrics show cumulative count of Article Views (full-text article views including HTML views, PDF and ePub downloads, according to the available data) and Abstracts Views on Vision4Press platform.
Data correspond to usage on the plateform after 2015. The current usage metrics is available 48-96 hours after online publication and is updated daily on week days.
Initial download of the metrics may take a while.