| Issue |
BIO Web Conf.
Volume 30, 2021
II International Symposium “Innovations in Life Sciences” (ILS 2020)
|
|
|---|---|---|
| Article Number | 01001 | |
| Number of page(s) | 7 | |
| Section | Innovations in Food Industry Technology | |
| DOI | https://doi.org/10.1051/bioconf/20213001001 | |
| Published online | 22 April 2021 | |
The technology of curd cake with sucralose: a infrared spectroscopy analysis
Educational and Research Institute of Food Technology and Business, Kharkiv State University of food technology and trade, Kharkiv, Ukraine
* Corresponding author: eaksonova@gmail.com
The article presents the results of developing technology for the production of curd cake using a low-calorie sweetener sucralose. The implementation of this direction in the form of a partial replacement in the sugar formulation for effective sweeteners sucralose is proposed. As a prototype, a sugar-based recipe was used, in which a partial replacement (at the level of 50%) of sugar with sucrose was carried out. Sucralose was formulated as the commercial sweetener TM Splenda, which contains maltodextrin and sucralose. All samples, including the control on sugar, were subjected to organoleptic evaluation, which showed the absence of extraneous flavors in all samples and their similarity in terms of sweetness compared to control. IR spectra of the sweetener, curd cake with sugar, as well as curd cakes with 50% and 100% sugar substitution for sweetener were obtained and analyzed. The analysis showed the presence of identical characteristic bands on the spectra of the sweetener and samples of sucralose cakes, which suggests that the sweetener TM Splenda does not undergo thermal degradation when baking curd cake. However, the literature analysis indicates the danger of the formation of toxic gaseous substances that are obtained during the thermal treatment of products with sucralose.
© The Authors, published by EDP Sciences, 2021
 This is an Open Access article distributed under the terms of the Creative Commons Attribution License 4.0, which permits unrestricted use, distribution, and reproduction in any medium, provided the original work is properly cited.
1 Introduction
The global trend of an increase in the incidence of diabetes among the population and the emergence of a high percentage of overweight people are prompting the food industry to develop recipes for low-sugar flour confectionery or to completely replace it with highly effective sweeteners [1].
The wide range of sweeteners and the growing attention to them are explained by their significant economic advantages in relation to sugar, since they all have a sweetness coefficient much higher than that of sucrose and are easy to use. [2]. In general, they can be conditionally divided into two groups in terms of use in food technologies. Substances with almost “zero calories” and very intense sweet taste, which are used in small quantities to replace the sweetness of much higher amounts of sugar and are approved for use in the food industry, can be classified in the first group. The second group includes caloric substances that can replace both physical mass and the sweetness of sugar. Products of this type, sometimes referred to as “sugar replacers”or “bulk sweeteners,” include the sugar alcohols (also called “polyols”).
Sucralose belongs to the sugar substitutes of the first group. From a chemical point of view is a chloroderivative of sucrose and is known as the food additive E955. It is about 600 times sweeter than sugar but, this factor varies depending on the level of sucralose being used. Like sugar, sucralose is a white, crystalline, nonhygroscopic, free-flowing powder and freely soluble in water.
This sweetener has a zero glycemic index and zero caloric content. Although sucralose is made from sugar, the human body does not recognize it as a sugar and does not metabolize it; therefore, it provides sweetness with no calories. Sucralose was approved as a food additive in USA, Canada, UK and European countries, followed by others. It is on sale as a product under the trademark SРLENDA® (Brand Sweetener of Tate & Lyle РLC, UK), which also includes other related components. Flour confectionery, and in particular cheese cake, are in demand among consumers. And the development of a technology for the production of cheese cake with a partial replacement of sugar with sucralose is relevant for solving the problems of overweight and preventing type 2 diabetes. Earlier [3] we offered technology of curd cake with suclarose as sweetener. The organoleptic analysis of the obtained samples showed that the sweetness levels for sugar curd cake with and sucralose curd cake areidentical. This fact indirectly indicates the thermal stability of the sweetener used in the technology.
This technology was based on an approach with partial replacement of sugar with sucralose. In the process of optimizing this technology, two problems were identified. The first is related to the need for compensation of effect of added sugar on food quality. It is known that sugar is a structure-forming component [4]. This problem was solved by adding more formulation ingredients (curd). This procedure increased the amount of solids, the amount of which was reduced by partial replacement of sugar. The second problem was related to the safety of using sucralose in this technology, which requires a baking temperature of 170 ° C to prepare the product. This sweetener is known to be thermally stable up to temperatures 120 °C [1]. With regard to the behavior of sucralose as the temperature rises further, many questions arise about its ability to form chlorinated by-products. This issue has been studied in detail in numerous original research [5-9] and review papers [10, 11].
Table 1 provides an overview of some of the research on the thermal decomposition of sucralose. In most publications, the object of these studies is pure sucralose. Only in work [5] real samples of food with sucralose were investigated. However according [8], these results lack credibility due to inefficient separation technique with thin-layer chromatography used in analysis of degradation products.
Most research suggests that thermal decomposition of Sucralose is associated with the release of chlorides, leading to the formation of possibly harmful compounds [11]. The most detailed analysis on this issue was carried out on the basis of literature data in [10]. According to this review, available data indicate that harmful compounds, some of which are carcinogenic, can occur when sucralose, and especially foods containing sucralose such as canned vegetables or baked goods, are heat-treated. When sucralose is heated to temperatures above 120 ° C, the sweetener gradually decomposes and dechlorinates. Temperatures of 120-150 ° C are possible during industrial food production and processing, and are also reached in private households during the preparation and baking of foods containing sucralose. This can lead to the formation of potentially hazardous chlorinated organic compounds such as polychlorinated dibenzo-p-dioxins (PCDD), dibenzofurans (PCDF) and chloropropanols. However, there are currently insufficient data for final conclusions.
The data in Table 1 indicate that the spectroscopic method in the infrared region was used as one of the most common experimental physicochemical methods for studying the decomposition products of sucralose. Fourier transform infrared spectroscopy is a powerful as a primary tool that facilitates the study of materials in matrix of foods. The technique allows monitoring the changes in various chemical bonding compounds. On the other hand, FTIR spectroscopy can be used as the technique of complementary measurement to help interpret the results along with other techniques. This determined the choice of the method in this work, the purpose of which was to study the possibility of the safe use of sucralose as a sweetener in the production of baked goods using the example of curd cake production.
Study of thermal degradation of sucralose
2 Experimental
2.1 Materials
The ingredients used in this study obtained from local stores in city Kharkiv, Ukraine. sucralose as SPLENDA TM was purchased from tate&lyle plc, uk and used was food grade. according to the manufacturer’s information on the packaging, the sweetener contains maltodextrin (ìd) and sucralose (according to information available on the internet, the content of sucralose is 1%). potassium bromide (reachim, russia) used was analytical grade.
2.2 Sampling
A curdcake was manufactured according to [3]. The product included wheat flour, butter, milk cheese 9%, melange and baking powder. In the production of curdcake was used sucralose in the form of sweetening SPLENDA TM. The manufacturer of this brand states that the product contains not only sucralose but also maltodextrins. The full chemical composition in percentage on the package is not indicated. However, according to literature data, this product contains 1% sucralose. Therefore, a sweetener based in sucralose was added based in a partial (50%) and full (100%) sugar substitute in and amounted to 0.10 and 0.05 g, respectively. Cheese cakes samples with a mass of 100 g were baked in silicone forms at a temperature of 170° C for 30 minutes.
The samples obtained using this technology were designated as S50 and S100, respectively, for curd cake with 50% and 100% sugar substitution. The prototype on sucrose sample was considered in the study as Control.
2.3 Methods
Fourier transform infrared coupled to attenuated total reflectance (ATR–FTIR) spectra of curd cake samples were obtained using Nicolet iS5 FT-IR spectrometer with the versatile iD5 ATR Accessory (Thermo Scientific, USA) as the result of the accumulation of 32 scans with a resolution of 4 cm-1 in the range of 4000-600 cm-1 .
FTIR spectra of SÐLENDA were recorded between 4000 and 400 cm–1 using a the same spectrometer with Thermo Scientific Base Adapter in a potassium bromide matrix. Discs of matrix were prepared by first mixing 0.5 mg of dried sample with 500 mg of KBr in an agate mortar and then pressing the resulting mixture. A pellet containing only potassium bromide was prepared and used as the reference sample for transmission measurements.
Each spectrum was converted to ASCII format to be further processed. Processing of spectroscopic data obtained including spectral pretreatment (correction of baseline, ATR correction and correction for ambient carbon dioxide, smooth of spectra) were performed with the Know It All Informatics System 2020, Academic Edition (John Wiley&Sons Inc., USA) software.
3 Results and discussion
Obtained in the FTIR spectra of the sweetener TM SPLENDA is given on Fig. 1. As already mentioned, the sweetener contains maltodextrin and sucralose, and the content of maltodextrin is approximately one hundred times higher than that of sucralose. Thus, it was maltodextrin that made the main contribution to the obtained results. Based on literature data [12], the spectrum for MD exhibited a strong broad absorption band centered at 3300 cm-1 and a weak band at ~1635 cm-1 which arise from OH-stretching and OH-bending (in plane) modes, respectively. An absorption band of CH stretching vibrations was found at 2900 cm-1. The spectrum of the sweetener shows that the broad intense band observed for maltodextrin at 3300 cm-1 is shifted to 3420 cm-1. An upward shift is also observed for the band corresponding to CH-stretching absorption band 2930 cm-1. The shift of these bands can be explained by the presence of sucralose, which contains chlorine atoms, which, possibly, affect the redistribution of electron density within the molecule and reduce the possibility of the formation of intraand intermolecular bonds for hydroxyl groups. A weak band at 1635 cm-1 is observed on the spectrum of the sweetener as well as on the spectrum of pure MD.
The results of studies indicate the existence in the spectrum of characteristic bands of 635 cm-1, which correspond to strength vibrations of the C-Cl bond in the sucralose molecule [13]. It is this band that makes it possible to identify sucralose in the composition of the sweetener.
The spectra of samples Control, S50 and S100 are shown in Fig. 2. The contribution of water to the formation of the OH-stretching absorption band in carbohydrate-water systems is very strong. In these systems clusters of water molecules could be categorized into three families according to their hydrogen bond organization. The first, originating from tetrahedrally bonded water molecules, namely networking water, locates in the region of around 3300cm-1 to 3314 cm-1. The second is intermediate water, which is a weakly or distorted hydrogen bonded family locates at around 3441 to 3470 cm-1. The last family is free or multimer water, which originates at around 3570 to 3610 cm-1 from water monomers and dimers and locates [14-16].
The spectra of cake samples have bands with peaks at 3275 cm-1 Control, 3281 cm-1 S50 and 3355 cm-1 for S100, which indicates that water in the product, is mainly in the form of networking water (Fig.3).
It should also be noted the shift of this band to the region of large values with increasing concentration of the sweetener. For sample S100, this value is already 3355 cm-1, which is very close to the indicator of this band in the spectrum of pure sweetener 3420e3420 cm-1. This again speaks in favor of the fact that the sweetener is preserved during heat treatment. In addition, the water begins to change to the state intermediate water weakly or distorted hydrogen bonded.
The spectra next from the fingerprint region, in the range of 1800 to 1600 cm-1, which usually arise from H-O-H-bending of water molecules [17]. Thus, the bands in the range of 165011630 cm-1 can be attributed to water of crystallization, and the spectra clearly show the dependence between the sugar content and the amount of water of crystallization: in a sample with 100% sugar replacement by sweetener, this band is the most intense, and in the sample with sugar it is practically absent (Fig 2).
This region of 1800 to 800 cm-1 the so called a “fingerprint” region. Vibrations in this region are mainly attributed to in-ring CO-stretching, interring COC-, COH- and CCH- bending, and symmetrical deformations of CH2 groups. Vibrations of 1035–1030 cm-1 are identified as aromatic C-H planar bending vibrations. This band is clearly visible on the sweetener spectrum.
It is absent in the spectrum of the sample with sugar, and in the spectra of samples on sucralose this band is shifted to a lower region - 1021 cm-1 and 1023 cm-1 for samples S50 and S100, respectively (Fig. 2). This fact may also be a reason to think that the sucralose molecule has not undergone thermal degradation.
However, one should take into account the risks of the appearance of substances hazardous to health during the heat treatment, which can also be identified using IR spectra. Most studies suggest that thermal decomposition of Sucralose is associated with the release of chlorides, resulting in the formation of possibly harmful compounds [11,18].
It should be noted, that in the obtained spectra of samples of curd cake with sucralose, peaks at 1743 cm-1 are observed. These peaks, as in [7], can be attributed to the carbonyl stretching frequency appeared after heated the sample is up to 130ºC. However, these peaks may not necessarily be associated with the degradation of sucralose, most likely the thermal transformation of other nutrients present in the formulation also contributes to their appearance. This fact is also confirmed by the fact that the same band is present in the spectrum of the “control” sample, in the production of which sucralose was not used. Therefore, rather, this band can be explained by the occurrence of the Maillard reaction.
The results of FTIR analysis presented in [9] show that at the point of decomposition of sucralose one can observe characteristic profiles of water (ranges from 4000–43200 cm-1 and 2000–1200 cm-1), carbon dioxide (the main peak at 2400–2300 cm-1), hydrogen chloride (range from 3100–32600 cm-1) and chloroacetaldehyde (main peak at 1850–11700 cm-1). However, such a complex system as curd cake requires water. As for the bands that can be attributed to carbon dioxide, they were not found in the finished product. The latter suggests that the identification of CO2 is relevant when studying the thermal decomposition of pure sucralose. In such complex systems as food systems, it is not correct to conclude that sucralose decomposes by the presence of peaks that can be attributed to CO2. The peak attributed to chloroacetaldehyde may also be associated with a carbonyl group, which does not have to be part of chloroacetaldehyde. For example, the Maillard reaction leads to the formation of numerous pore products with a rather complex and often unknown structure, among which there are compounds containing a carbonyl group. In addition, the 1850–1700 cm-1 region can be associated with a number of carbonyl compound group frequencies [19].
Among the compounds hazardous to health that can appear in food during the thermal decomposition of sucralose, there may also be: chloropropanols, PCDD and PCDF congeners and dioxin-like polychlorinated biphenyls (dl-PCBs), Polychlorinated naphthalene (PCN) congeners. However, it should be noted that chloropropanols in the study [8] were found in the released gas phase.
The authors [20] concluded that the heating (roasting) of Sucralose in the presence of soybean oil and beef at 250°C led to the formation of various toxic PCDF and PCDD congeners which were transferred from the solid to the gas phase. Moreover, they emphasized that it is important to ensure effective ventilation when cooking with Sucralose in order to reduce the exposure risk of consumers to the occurring volatile PCDFs and PCDDs via inhalation.
The authors concluded that, due to thermal decomposition during heating (roasting) to 160°C in the presence of soybean oil and beef, Sucralose became a source of chloride, which in turn promoted the formation of dl-PCB compounds, which were finally found in the oil vapors. They also hypothesised that an “appropriate” use of chloride-containing additives during cooking could therefore help to reduce exposure of consumers to dl-PCBs [21].
In [22] it is said that that heating of Sucralose together with peanut or olive oil free of PCN, can lead to the formation of various PCN congeners as well as PCDD, PCDF and PCB compounds, which were released with the vapors generated during the further course of the process.
It should be noted separately that most of the studies in which the thermal degradation of sucralose was studied were carried out at temperatures above 200°C. These temperatures are significantly higher than those used in baked goods technologies. You should also pay attention to studies on the study of the temperature gradient in baked goods during their production [23-25]. So the author of [23] showed that the temperature of the central layers of biscuit crumb is 97–l98°C at the end of baking. Similar studies for muffins [24] indicate a temperature at the end of baking of 103–104 °C. The crumb temperature at the end of baking for muffins was 100–101°C, which was reached for muffins on sucrose in 25 minutes, and on fructose in 23 minutes [25].
In the same work, the authors noted that the temperature in the samples during baking does not exceed the decomposition temperature of sucralose. But on the surface, the temperature rises to 120°C for 12 minutes of baking for muffins on sucrose and from 12 to 24 minutes of baking - up to 160°C at a working chamber temperature of 180°C. Thus, we can conclude that the thermal decomposition of sucralose during the manufacture of curd cake does not occur, although it cannot be ruled out that part of sucralose is involved in thermal degradation. It should also be noted that the issue of products generated during this process remains open and requires integrated approaches.
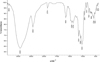 |
Fig. 1. FTIR spectra of SPLENDA. |
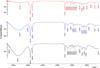 |
Fig. 2. Representative ATR-FTIR spectra in the fingerprint region of the curd cake samples: control (red), S50 (blue) and S100 (black) |
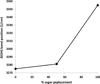 |
Fig. 3. Band positions of OH-stretching vibration for curd cake samples |
4 Conclusion
An analysis of the literature showed that Sucralose is dechlorinated and this may lead to the formation of chlorinated organic compounds with possibly harmful potential (e.g. polychlorinated dibenzo-para-dioxins or dibenzofurans or chlorpropanols). The literary analysis also showed that, it can be concluded that substances hazardous to humans were detected in the gas phase formed during the heat treatment of the food product, and were not identified in the finished product using the analysis of IR spectra. Moreover, most of the research has been conducted at temperatures higher than those used to make curd cake.
Based on the currently available data, it is impossible to judge the degree of formation of toxicologically significant congeners and to attribute them directly to the presence of sucralose. Since the ongoing Maillard reactions lead to the formation of not only dioxins, but also other potentially toxic compounds.
The spectra of cake samples have bands with peaks in range 3275–3355 cm-1, which indicates that water in the product is mainly in the form of networking water. A shift of this band to the region of large values is observed with an increase in the concentration of the sweetener. For sample S100, this value is already 3355 cm-1, which is very close to the indicator of this band in the spectrum of pure sweetener 3420 cm-1. This once again speaks in favor of the fact that the sweetener is preserved during heat treatment.
The spectra of samples of curd cakes with sucralose have peaks in the range of 1035–1030 cm-1, which are identified as aromatic C–H planar bending vibrations. This band is clearly visible on the sweetener spectrum. It is absent in the spectrum of the sample on sugar, but in the spectra of samples on sucralose this band is shifted to a lower region. This also suggests that the sweetener has not undergone thermal degradation. This also indicates that chlorine is in a bound state, and this indicates the impossibility of forming substances hazardous to human health.
Analysis of IR spectra cannot be proposed as a 100% reliable method for identifying potentially hazardous substances in food (chloropropanols, polychlorinated dibenzo-para-dioxins, polychlorinated dibenzofurans congeners, dioxin-like polychlorinated biphenyls and polychlorinated naphthalene congeners).
The presented results indicate that further studies of the thermal behavior of sucralose in food products are needed using a combination of physicochemical methods. Moreover, both the final product and the products that are obtained at different stages of heat treatment should be investigated.
References
- K. O’Donnell, M.W. Kearsley, (eds.), Sweeteners and Sugar Alternatives in Food Technology (Second Ed., Oxford: Wiley-Blackwell, 2012). [Google Scholar]
- L. O’Nabors, Alternative Sweeteners (Boca Raton: CRC Press 2012). [Google Scholar]
- O. Aksonova, S. Gubsky, D. Torianik, N. Murlykina, Progressive Technique and Technologies of Food Production Enterprises, Catering Business and Trade, 1, pp. 7 (2020). [Google Scholar]
- R. A. Clemens, J. M. Jones, M. Kern, S.-Y. Lee, E. J. Mayhew, J. L. Slavin, and S. Zivanovic, Comprehensive Reviews in Food Science and Food Safety, 15, pp. 433 (2016). [PubMed] [Google Scholar]
- R.L. Barndt, G. Jackson, Food Technology (Chicago), 44, pp. 62 (1990). [Google Scholar]
- S.A. Hutchinson, S. Ho Gregory and Ho Chi-Tang, Food Reviews International, 15, pp. 249 (1999). [Google Scholar]
- G. Bannach, R. R. Almeida, L. G. Lacerda, E. Schnitzler, and M. Ionashiro, Eclética Química, 34, pp. 21 (2009). [Google Scholar]
- A. Rahn, A.Ya. Varoujan, Food Chemistry, 118, pp. 56 (2010). [Google Scholar]
- D. N. de Oliveira, Maico de Menezes, and Rodrigo R. Catharino, Scientific Reports, 5, pp. 1 (2015). [CrossRef] [Google Scholar]
- BfR - Bundesinstitut für Risikobewertung. 2019. “Harmful Compounds Might Be Formed When Foods Containing the Sweetener Sucralose Are Heated,” BFR (No 012/2019): 1–22. [Google Scholar]
- S.S. Schiffman, K. I. Rother, Journal of Toxicology and Environmental Health Part B: Critical Reviews, 6, pp. 399 (2013). [Google Scholar]
- E. Sritham, S. Gunasekaran, Food Hydrocolloids, 70, pp. 371 (2017). [Google Scholar]
- B. Guven, S. D. Velioglu, I. H. Boyaci, Gida, The Journal of Food, 44, pp. 274 (2019). [Google Scholar]
- M.E. Gallina, P. Sassi, M. Paolantoni, A. Morresi, and R. S. Cataliotti, The Journal of Physical Chemistry B, 110, pp. 8856 (2006). [PubMed] [Google Scholar]
- A. Lerbret, P. Bordat, F. Affouard, Y. Guinet, A. Hédoux, L. Paccou, D. Prévost, and M. Descamps, Carbohydrate Research, 340, pp. 881 (2005). [PubMed] [Google Scholar]
- J. Malsam, A. Alptekin, The Journal of Physical Chemistry B, 113, pp. 6792 (2009). [PubMed] [Google Scholar]
- A. Gharsallaoui, B. Rogé, J. Génotelle, M. Mathlouthi, Food Chemistry, 106, pp. 1443 (2008). [Google Scholar]
- S. S. Schiffman, Chemical Senses, 37, pp. 671 (2012). [PubMed] [Google Scholar]
- J. Coates, Encyclopedia of Analytical Chemistry. Chichester (UK: John Wiley & Sons, Ltd., 2006) [Google Scholar]
- J. Wu, S. Dong, G. Liu, B. Zhang, M. Zheng, Journal of Agricultural and Food Chemistry, 59, pp. 5444 (2011). [PubMed] [Google Scholar]
- S. Dong, J. Wu, G. Liu, B. Zhang, M. Zheng, Food Control, 22, pp. 1797 (2011). [Google Scholar]
- A. Fernandes, M. Rose, J. Falandysz, Environment International, 104, pp. 1 (2017). [PubMed] [Google Scholar]
- E. Bondarenko, Studies of the Kinetics of the Biscuit Baking Process Semi-Finished Products (Kiyv: KTIFI, 1979). [Google Scholar]
- V. V. Dorokhovich, Development of rational technologies of diabetic flour confectionery products based on fructose (Kiyv: NUFT, 2000). [Google Scholar]
- A. Dorokhovich, N. Lazarenko, Progressive Technique and Technologies of Food Production Enterprises, Catering Business and Trade, 1, pp. 414 (2012). [Google Scholar]
All Tables
All Figures
|
Fig. 1. FTIR spectra of SPLENDA. |
| In the text | |
|
Fig. 2. Representative ATR-FTIR spectra in the fingerprint region of the curd cake samples: control (red), S50 (blue) and S100 (black) |
| In the text | |
|
Fig. 3. Band positions of OH-stretching vibration for curd cake samples |
| In the text | |
Current usage metrics show cumulative count of Article Views (full-text article views including HTML views, PDF and ePub downloads, according to the available data) and Abstracts Views on Vision4Press platform.
Data correspond to usage on the plateform after 2015. The current usage metrics is available 48-96 hours after online publication and is updated daily on week days.
Initial download of the metrics may take a while.