| Issue |
BIO Web Conf.
Volume 10, 2018
Contemporary Research Trends in Agricultural Engineering
|
|
|---|---|---|
| Article Number | 02034 | |
| Number of page(s) | 6 | |
| Section | Engineering and Technology | |
| DOI | https://doi.org/10.1051/bioconf/20181002034 | |
| Published online | 26 March 2018 | |
Analysis of heat source selection for residential buildings in rural areas
Faculty of Production and Power Engineering, University of Agriculture in Krakow, Poland
* Corresponding author: This email address is being protected from spambots. You need JavaScript enabled to view it.
Abstract
The research aiming to check whether the output of currently installed boilers matches the use requirements together with estimation of their energy efficiency was carried out on a group of 84 single-family residential buildings located in rural areas. Heating and hot water energy needs were calculated for each building in order to determine the use requirements. This enabled verification whether the currently installed boilers match the actual use requirements in the buildings. Based on the calculations it was determined that the designed average boiler output in the group of buildings subject to analysis is 15.7 kW, whereas the mean rated output capacity of boilers installed therein is 25.4 kW. On average, the output capacity of the installed boilers exceeds the use requirements for the buildings by 60%. To calculate the energy efficiency of boilers, the mean annual boiler output capacity use coefficient was determined. For boilers selected on the basis of standard calculations, the mean coefficient is 0.47. For boilers currently in use it is 0.31, less than the above figure. The above calculations show that if boilers were correctly selected in compliance to the building needs, then the average estimated seasonal efficiency of 65% would be feasible. However, in the current state the achievable efficiency is approx. 55%.
© The Authors, published by EDP Sciences, 2018
 This is an Open Access article distributed under the terms of the Creative Commons Attribution License 4.0, which permits unrestricted use, distribution, and reproduction in any medium, provided the original work is properly cited. (http://creativecommons.org/licenses/by/4.0/).
1 Introduction
The Act on the Energy Performance of Buildings [1] implements Directive 2010/31/EU [2] into the Polish law. It introduces two mechanisms designed to reduce energy consumption in buildings: an energy assessment and regular systematic heating system technical-state inspections. The Act explains issues associated with the principles for preparing energy performance certificates for buildings. It prescribes two methods of estimation of energy needs: a method based on standard building use and a method based on actual energy consumption. The legislator also defined the building types for which an energy performance certificate has to be drawn up as well as building types which are exempt from this obligation. The aforementioned Act also sets out the principles for inspection of heating and air conditioning systems in buildings, where by virtue of the provisions the building owner or administrator is obliged to periodically inspect buildings in use, which entails checking the heating system technical-state, including energy efficiency of boilers and ensuring that their output is relevant for the given use requirements. The time period for completing tests and threshold output values for boilers which are to be subjected to the tests are set forth. The lower 20 kW threshold specified in the Energy Performance Act applies to all types of fuels, both renewable and non-renewable. In the past, the Building Law Act [3] set forth the obligation to perform periodic boiler inspections, where the principles for heating system inspections were prescribed together with their frequency, which varied depending on the output. It also specified the types of buildings exempt from the inspection obligation. According to the provisions of the said Act, the obligation to carry out inspections did not apply to owners and administrators of single-family residential houses, structures; homesteads and summer houses. Following amendments to the Building Law Act [4], the provisions in question, were moved to the Act on the Energy Performance of Buildings [1], however the provision specifying buildings which are excluded from the inspection obligation was not moved, and as such the obligation to inspect boilers prescribed by the Act applies to all buildings, including single-family houses and homesteads which are heated by sources with a rated output of more than 20 kW.
In rural areas the percentage of heat energy used for heating and hot water needs in residential homes constitutes ca. 82% to 85% of the total energy consumption. Most of these buildings (>70%) use solid fuels (coal, wood) for heating purposes and are responsible for emitting ca. 75% and even up to 90% of harmful pollutants into the atmosphere [5-8]].
Literature on the subject contains results of research on appropriate selection of heat sources and efficiency of heating systems in households in single-family residential buildings in Belgium and Great Britain, where heating oil and natural gas fired boilers are used [9, 10]]. Whereas papers [11, 12]] include results of tests on boilers used to heat multi-family residential dwellings in Canada as well as office buildings in Great Britain. Authors of the afore-cited papers indicate that heat sources are oversized by between 30% [10, 11]] and 300% [9] in relation to the actual demand for heat. Heating systems often operate at low efficiency, in the region of 30% - particularly in buildings with good heat insulation envelopes. At the same time, the authors estimate that correct selection, control and use of heating systems may deliver potential energy savings of ca. 20%, which will also contribute to the reduction of air pollution emissions. In Poland, and particularly in rural areas where single-family residential houses are predominant, research of this type has not been conducted. The objective of the paper was to verify and determine whether heat sources were selected suitably to heating needs (heating, domestic hot water) in single- family residential buildings and also to estimate their energy efficiency.
2 Research area
The research was conducted in Kraków province located in Małopolskie Voivodeship. According to the Polish Central Statistical Office (GUS) data, there are 73.1 thousand single-family residential buildings across the 17 municipalities comprising the research area. 69% of these buildings are heated by solid fuel fired boilers (GUS). This was applied as the basis for determination that 81 buildings are the minimum sample size (for α = 0.95 confidence level and maximum error of 10%) required for the research. A sample of 84 single-family residential buildings heated by solid fuel (coal) fired boilers was used. Within the scope of the research, information was collected pertaining to the heated surface area, building envelope surface where heat loss occurs, heated and ventilated volume, materials used to construct the envelopes, window types, methods for obtaining domestic hot water, type and age of installed boilers and their rated output (as shown on name plates). Information related to any potential thermal-upgrade actions in the buildings was also collected. Figure 1 presents the sample structure in terms of the construction date of buildings according to the Polish Central Statistical Office (GUS) data and buildings for which research was carried out.
Age brackets were determined pursuant to the provisions which are presently in force and prescribe the maximum heat loss coefficient Umax for the building envelope during periods when the standards are applicable, as well as pursuant to appropriate industry regulations.
The average floor area to be heated in buildings subject to analysis is 118 m2 and the average volume is 354 m3. The analysed buildings, and in particular those built pre-2003 were subjected to thermal-upgrade works - these constitute 39% and in 73% of those, the thermal- upgrades entailed application of additional thermal insulation to the external building walls and the remainder entailed application of additional roof insulation. The average additional external wall insulation in the group of buildings subject to analysis is 7.6 cm, with 9.2 cm for roofs.
Windows were replaced in 76% of the buildings, mainly with PVC single chamber multiple glazed units.
In the group subject to the research, 67% of buildings use a boiler for heating and domestic hot water needs and in the remaining percentage other heating devices are used for domestic hot water needs. Heat sources installed in buildings mainly comprise lower combustion chamber boilers (88%) and retort boilers. The boilers are mainly fired with black coal (different types) and wood. Survey questionnaires indicate that on average wood constitutes 29% of the combusted fuel. On average, the installed boilers are 12 years old. Figure 2 presents a boiler sample structure according to age.
15 - 20 year old boilers are the largest group with a 29% share, a large percentage of boilers over 20 years old have also been recorded (19%) - these are mostly boilers with cast iron heat exchangers. The new boilers' group (6 - 9 years old) mostly comprises steel chamber boilers. The newest boilers predominantly constitute retort boilers with fuel hoppers.
Boiler sample structure according to output is shown in Figure 3.
The rated outputs of the boilers are within the 12 to 41 kW brackets, whereas the most populous group constitute boilers between 21 and 25 kW - 35% and the output of approximately 13% of boilers exceeds 30 kW.
 |
Fig. 1. Age structure of residential buildings in rural areas of Kraków province |
 |
Fig. 2. Boiler sample structure according to age |
 |
Fig. 3. Boiler sample structure according to rated output |
3 Methodology
Heat demand for heating buildings was calculated according to PN-EN 12831 standard, temperatures as prescribed by standards were adopted for the calculations, i.e. internal temp. of 20°C and external for Climate Zone III, for which the design external temperature is -20°C. The heating season length (222 days) and the average external temperature during the heating season (4.04 °C) were adopted on the basis of data from the Kraków–Balice meteorological station. The heat source output for domestic hot water needs in a tank based system was calculated on the basis of PN-92/B-01706 standard. Calculations were performed for the actual number of people residing in the given building.
To facilitate comparison between buildings in different age groups, average values for the unitary heating energy need indexes were determined and expressed in W·m-2 of the floor area which required heating. Due to the fact that thermal-upgrades were applied to a number of buildings, indexes in given age- groups were also determined. Separate indexes were determined for buildings in their as-is condition (constructed in accordance with the provisions pertaining to the maximum value of the building envelope heat loss coefficient applicable during given time periods) and those subject to thermal-upgrade works. Calculation results are shown in Figure 4.
The average energy needs index for the group of buildings subject to analysis was 104 W·m-2. It was 112 W·m-2 for buildings in the as-is condition and 78 W·m-2 for buildings subjected to thermal-upgrade works. Thermal-upgrade works on buildings constructed pre- 2003 reduced building envelope heat loss by approx. 23%.
Heating and domestic hot water energy needs were calculated using the following formula:
 (1)
(1)where:
QH – design building heat load acc. to PN-EN 12831,
QW – domestic hot water power needs, based on the hot water tank system, acc. to PN-92/B-01706.
Efficiency of a solid fuel fired boiler as quoted by the manufacturer is a value obtained under test conditions subject to continuous combustion of the boiler's design fuel. According to experience, in actual use conditions, with inferior quality fuel and a contaminated heating surface, the boiler's actual output may be slightly different from that measured in laboratory conditions [13] and as such, in selecting boiler output in practice, the following formula is used:
 (2)
(2)Boiler energy efficiency may be estimated by calculating annual average coefficient of boiler capacity use under partial loading [14]. The coefficient stems from the following function:
 (3)
(3)Whereas its value can be calculated in accordance with VDI 2067 standard:
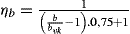 (4)
(4)In order to determine it, an additional ratio has to be estimated, bVk - hours of full use with reference to QBmax capacity:
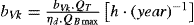 (5)
(5)where:
QAve – seasonal average boiler capacity kW,
b – standby time [h(year)-1],
bVh – full use hours with reference to QH [h(year)-1],
ηb – boiler output use coefficient under partial load
ηd – average seasonal heat distribution efficiency,
QT – design heat demand kW,
QBmax – installed boiler rated output kW (for existing boilers enter QK output as quoted on the name plate).
 |
Fig. 4. Unitary heating output needs for buildings |
4 Research results review
The conducted research and ensuing calculations made it possible to check and determine whether heat sources were selected appropriately to heating needs in buildings. The average design boiler output in the group of buildings subject to analysis is 15.7 kW, whereas the mean rated output capacity of boilers installed therein is 25.4 kW.
Figure 5 shows a comparison of boiler outputs – design, calculated according to standards and actual for the heat sources in buildings per age group.
Analysing the data, one may conclude that in every case, rated power of installed boilers exceeds the requirements of the buildings use. Buildings constructed between 1975 - 1982 and 1992 - 2002 exhibit the highest surplus power: the average of approx. 1.8 - 2.1. In other groups, boiler excess power is somewhat lower, within 1.5 - 1.6 range. On average, the output capacity of installed boilers exceeds the buildings' needs by 60%.
The boiler sample structure according to the level to which they match requirements is shown in Figure 6.
In the group of buildings subject to analysis, 18% of boilers match needs relatively well - their rated output is approx. 1.3 times the actual energy needs of buildings. Most often (45%), rated output of boilers is between 1.4 and 1.6 times bigger. For 13% of the boilers, their output exceeds the demand by more than twofold.
Research has shown, that the amount of boiler excess output depends on whether the boiler is used solely for heating purposes or also for domestic hot water. In this case boilers performing two functions (heating and domestic hot water) better match the needs, with the rated output approx. 50% higher than the designed. If boilers are used solely for heating buildings, their output compared to actual needs is 70% higher (Fig. 7).
Even larger differences are seen for boilers installed in buildings whilst still in the as-is condition, and those subsequently subjected to thermal-upgrades. Boilers used as the heat source within buildings in the as-is condition match their needs significantly better - with the average of 48% power surplus. Buildings which were subjected to thermal-upgrades show significantly larger boiler excess power compared to actual needs – here the rated output exceeds the power figures obtained on the basis of design calculations by 80%. In the majority of tested buildings that surplus results from thermal- upgrades, which reduced heat loss through the building's envelope but failed to take into account heating system modernisation.
Estimating boiler energy efficiency entailed calculating ηb – boiler output use coefficient under a partial load. On the basis of calculations, the standby time b was arrived at as well as the hours of full use bVk with reference to QBmax and for the average rated output values QK for boilers installed in buildings, for which five variants were identified: rated power of boilers: installed in all buildings, within buildings in the as-is condition, in buildings subject to thermal-upgrades. Furthermore the ηb coefficient was estimated for buildings, where the boiler is solely used for heating as well as for those where it performs both functions, i.e. heating and domestic hot water.
Climate data was used for the calculations from the nearest meteorological station the scope of which extends across Kraków province. Figure 8 shows the coefficient values.
The average annual boiler output use coefficient selected pursuant to calculations based on standards is 0.47, on average. For boilers currently in use it is 0.31, less than the above figure. The lowest value for this parameter was obtained in buildings which were subjected to thermal-upgrade works and where the boiler is used only for heating - 0.28 and 0.29 respectively. It is much better if the boiler is also used for domestic hot water purposes, as that increases the coefficient to 0.41.
The boiler output use coefficient was used to estimate the average seasonal boiler efficiency. Due to the fact that lower combustion hopper chamber boilers constitute nearly 90% of the installed heat sources, calculations were only carried out for this group. Based on information received from the number of boiler manufacturers on the relation between the boiler efficiency and short term output under test conditions, averaged data was plotted to depict the boiler average seasonal efficiency as a function of the boiler load degree (ηb). This made it possible to approximately estimate the efficiency with which heat sources operate. The average seasonal efficiency was determined for the same variants which were analysed for the average annual boiler output use coefficient under partial load ηb. Results are shown in Figure 9.
Boilers correctly selected to match the building needs (A) could exhibit an average estimated seasonal efficiency of 65% which is in accordance with the provisions in the methodology for drawing up energy efficiency certificates in buildings [15], while in the current state (C) the achievable efficiency is approx. 55%. The lowest average seasonal efficiency was reached by boilers in buildings subjected to thermal- upgrades (D) and those which are only used for heating (E). The use of an existing boiler also for domestic hot water needs (B) may improve its efficiency even up to approx. 58%.
 |
Fig. 5. Comparison between design and actual output of installed boilers |
 |
Fig. 6. Boiler sample structure according to the level to which they match requirements |
 |
Fig. 7. Degree to which the output currently installed boilers matches the buildings' needs |
 |
Fig. 8. Boiler output use coefficient under partial load - average annual values |
 |
Fig. 9. Boiler average seasonal efficiency as a function of boiler load degree |
5 Conclusion
As a result of the calculations it was determined that the designed average boiler output in the group of buildings subject to analysis is 15.7 kW, whereas the mean rated output capacity of boilers installed therein is 25.4 kW. On average, the output capacity of installed boilers exceeds the building needs by 60%. As shown by the research, the amount boiler excess output depends on whether the boiler is used solely for heating purposes or also for domestic hot water. In this case boilers performing two functions (heating and domestic hot water) better match the needs, with the rated output of approx. 50% higher than the calculated one, whereas if boilers are used solely for heating buildings, their output compared to needs is 70% higher. Even larger differences are seen for boilers installed in buildings whilst still in the as-is condition (constructed in accordance with the provisions pertaining to the maximum value of the building envelope heat loss coefficient) and those subsequently subjected to thermal- upgrades. Boilers used as the heat source within buildings in the as-is condition, significantly better match their needs - with the average of 48% power excess. Buildings which were subjected to thermal- upgrades show significantly larger boiler excess power compared to actual needs - here the rated output exceeds the power figures obtained on the basis of design calculations by 80%. To calculate the energy efficiency of boilers, the mean annual boiler output capacity use coefficient was determined. For boilers selected on the basis of standard calculations, the mean is 0.47. For boilers currently in use it is 0.31, less than the above figure. The lowest value for this parameter was obtained in buildings which were subjected to thermal-upgrade works and where the boiler is used only for heating - 0.28 and 0.29 respectively. The above calculations show that if boilers were correctly selected in accordance with the building needs, then the average estimated seasonal efficiency of 65% would be feasible. However, in the current state the achievable efficiency is approx. 55%. The lowest average seasonal efficiency was reached by boilers in buildings subjected to thermal-upgrades and those which are only used for heating - their efficiency is only approx. 52%.
References
- Act Dz.U. 2014. 1200, (2014) [Google Scholar]
- Act Dz. Urz. UE L 153. page. 13, (2010) [Google Scholar]
- Act Dz.U. Nr 197. 1373, (2007) [Google Scholar]
- Act Dz. U. 2016. 290, (2016) [Google Scholar]
- T. Szul. J. Res. Appl. Agric. Engng., 53, 1 (2008) [Google Scholar]
- T. Szul. J. Res. Appl. Agric. Engng., 53, 2 (2008) [Google Scholar]
- T.Szul. Inf. Ekol. Ter. Wie., 1 (2010) [Google Scholar]
- T. Szul. J. Res. Appl. Agric. Engng., 56, 1 (2011) [Google Scholar]
- L. Peeters, J. Van der Veken, H. Hens, L. Helsen, W. D’haeseleer. En. and Build., 40, 8 (2008) [Google Scholar]
- Z. Liao, AL Dexter, 36, 3 (2004) [Google Scholar]
- Z. Liao, M. Swainson, A. Dexter. En. and Build. 40, 3 (2005) [Google Scholar]
- Z. Yaohong, Z. Liao, RU, 1 (2005) [Google Scholar]
- K. Krygier, T. Klinke, J. Sewerynik. Ogrz. Went. Klimat. 1997 (2007) [Google Scholar]
- H. Recknagel, E. Sprenger, W. Hönmann, E. Schramek. OKCwCh. 08, 09 (2008) [Google Scholar]
- Act Dz.U. 2015. 376 (2015) [Google Scholar]
All Figures
|
Fig. 1. Age structure of residential buildings in rural areas of Kraków province |
| In the text | |
|
Fig. 2. Boiler sample structure according to age |
| In the text | |
|
Fig. 3. Boiler sample structure according to rated output |
| In the text | |
|
Fig. 4. Unitary heating output needs for buildings |
| In the text | |
|
Fig. 5. Comparison between design and actual output of installed boilers |
| In the text | |
|
Fig. 6. Boiler sample structure according to the level to which they match requirements |
| In the text | |
|
Fig. 7. Degree to which the output currently installed boilers matches the buildings' needs |
| In the text | |
|
Fig. 8. Boiler output use coefficient under partial load - average annual values |
| In the text | |
|
Fig. 9. Boiler average seasonal efficiency as a function of boiler load degree |
| In the text | |
Current usage metrics show cumulative count of Article Views (full-text article views including HTML views, PDF and ePub downloads, according to the available data) and Abstracts Views on Vision4Press platform.
Data correspond to usage on the plateform after 2015. The current usage metrics is available 48-96 hours after online publication and is updated daily on week days.
Initial download of the metrics may take a while.