| Issue |
BIO Web Conf.
Volume 12, 2019
41st World Congress of Vine and Wine
|
|
|---|---|---|
| Article Number | 02032 | |
| Number of page(s) | 3 | |
| Section | Oenology | |
| DOI | https://doi.org/10.1051/bioconf/20191202032 | |
| Published online | 19 February 2019 | |
Investigation of geographic origin of wine from border regions: Potential limitations and possibilities of different analytical methods and combinations of methods to identify the correct side of the border
1 Lehr- und Forschungszentrum Francisco Josephinum, Rottenhauserstraße 1, 3250 Wieselburg, Austria, and Department of Lithospheric Research, University Vienna, Althanstr. 14, 1090 Vienna, Austria
2 Czech Agriculture and Food Inspection Authority, Květná 15, 603 00 Brno, The Czech Republic
3 CEITEC, Masaryk University, Kamenice 5, Brno 62500, Czech Republic, and Department. of Chemistry, Faculty of Science, Masaryk University, Kamenice 5, Brno 62500, Czech Republic
4 National Agricultural and Food Centre, Food Research Institute / Department of Chemistry and Food Analysis, Priemyselna 4, 824 75 Bratislava, Slovak Republic
5 Höhere Bundeslehranstalt und Bundesamt für Wein- und Obstbau, Wienerstraße 74, 3400 Klosterneuburg, Austria
6 SP LABORATORIJA a.d., Member of VICTORIA GROUP, Industrijska 3, 21220 Becej, Serbia
Abstract
In the presented project the investigation on discrimination of geographic origin of wine in from border areas is carried out. Authentic wine samples from the border areas of Austria, Czech Republic, Slovakia (and from Serbia) are investigated and compared by applying different physico-chemical methods (e.g. IRMS, NMR, ICP-MS, ICP-OES, EPR, HPLC, UV-VIS, etc.). The comparison of the data sets from the participating countries and the different applied methods will show, to which extent a differentiation can still be achieved in the border areas of the respective countries, which methods prove most efficient and sensitive and if a combination of methods will lead to an increased sensitivity. Furthermore, we also investigate the causes for the potential differentiation, which might be environmentally determined, due to different agricultural and/or enological practices. Results from the first investigated vintage 2016 show a good separation of the respective geographic origins by isotope ratios and element concentrations as well as by other parameters. The relevant parameters for differentiation now have to be critically evaluated to exclude potential lab influences.
© The Authors, published by EDP Sciences, 2019
 This is an Open Access article distributed under the terms of the Creative Commons Attribution License 4.0 (http://creativecommons.org/licenses/by/4.0/), which permits unrestricted use, distribution, and reproduction in any medium, provided the original work is properly cited.
1. Introduction
Geographic border areas are always a difficult topic with respect of their characterization, as they very often are similar or almost identical on both sides of the border. Natural borders (e.g. mountain range, sea, desert, …) might facilitate the respective characterization, as such borders often result in significant differences with respect to environment, flora & fauna, etc.., due to their separating effect. On the other hand, however, political borders, drawn without taking into account natural borders/obstacles (or where the border is merely a river) usually have only minor natural (and other) differences between both sides of the border areas. Thus, correct classification of geographic origin in such border areas is a big challenge.
The authenticity and declared geographic origin of wine in the EU is controlled by comparison of isotope patterns of commercial samples with the patterns of authentic samples from the EU wine database. The latter has been founded in 1991 by an EU-regulation. The authentic samples have to be collected, produced and analysed following standardized methods.
To investigate the possibilities for differentiation in border areas we chose the Austrian-Czech-Slovak border region. This region is characterized geologically by the Molasse basin containing sediments of Tertiary to Quaternary age, confined by the Bohemian Massive in the Northwest and by foothills forming the transition from the Alps to the Carpathians in the Southeast. Significant parts of the border are defined by the rivers Thaya and March (and Danube).
Wine is produced on all sides of the borders, in the Austrian “Weinviertel” (wine district), in the Czech oblast Morava (Moravian region) and in the Slovak “Malokarpatska” (Little Carpathians) region.
Among the main varieties are Grüner Veltliner/Zelené Veltlínské, Müller-Thurgau, Welschriesling/Ryzlink vlašský/Rizling vlašský, Sauvignon (Blanc), Rheinriesling/Ryzlink rýnský, Pinot Gris/Rulandské šedé, Chardonnay; red varieties: Blauer Zweigelt, St. Laurent/Svatovavřinecké/Svätovavrinecké, and Blaufränkisch/Frankovka modrá on all sides of the borders.
The aim of the project is the in-depth investigation of wine samples coming from the different sides of the borders in Austria, Czech Republic, Slovakia (and also Serbia) followed by statistical analysis to identify methods and method combinations enabling a differentiation and correct classification of wine from the described border area. Furthermore, if this can be achieved, it is followed by an evaluation of the causes for the differentiation.
2. Material and methods
2.1. Sampling procedure
The current study compared the results of physico-chemical analyses of wine samples of similar grape varieties from the Austrian – Czech – Slovak border region and Serbia. In 2016 10 samples from Austria, 12 from Czech Republic, 5 from Slovakia and 1 from Serbia were obtained. For the Austrian, Czech and Slovak samples the procedures for grape collection, vinification, processing and analysis were carried out according to the regulations for the authentic samples for the EU wine database (EU regulation EC No. 555/2008 and the Compendium of the OIV [1]). Several of the samples were exchanged among the participating institutes for laboratory intercomparison tests.
2.2. Physico-chemical analysis
The primary chemical parameters of the musts were analysed using the FOSS Grape Scan 2000 (Rhine Ruhr, Denmark), Glucose, Fructose, volatile acidity, tartaric acid as well as the pH of the juice were measured by OIV official methods. Content of SO2 in wines was determined by Ripper titration. Alcohol content was determined by ebullioscope. Total and volatile acidity of wines was evaluated according to the AOAC methods [2] or OIV methods.
Major and trace element concentrations were measured by ICP-OES (iCAP 6000 series, Thermo, Germany) and ICP-MS (7500ce, Agilent, Japan). The wine samples were diluted by 5% HNO3. The dilution factor was 1:10. The quantification of the elemental concentration was done by external calibration with internal standard. As internal standard the solution of In was used. Major elements were measured by ICP-OES and the trace elements by ICP-MS.
Total phenolic compounds content was determined applying Folin-Ciocalteau modified method [3].
Total flavonoid compounds content (TFC) was determined according to the modified method described by Pallab et al. 2013 [4]. Briefly, 500 μl of wine sample, 1.5 ml of 96% ethanol, 2.8 ml of distilled water, 100 μl of 10% aluminium chloride and 100 μl of 1 mol/l potassium acetate were mixed. After 40 min, the absorbance of final solution was measured at 415 nm in 1cm quartz cuvette. Standard solutions of quercetin were used for calibration curve construction and the results were expressed as quercetin equivalents (QE, mg/l).
The ability to terminate ABTS•+ cation-radical (expressed as Trolox equivalents – TEAC), concentration of selected flavonoids (catechin, epicatechin, rutin, quercetin and resveratrol) and colour characteristics were determined as described in Tobolková et al., 2014 [5].
Phenolic acids were quantified with an Agilent Technologies HPLC system (Palo Alto, California, USA). Samples were injected with an autosampler. A variable wavelength detector was used for quantification at 280 nm wavelength for all phenolic acids. A quaternary pump was used for gradient formation. A Zorbax SB-C18 (Agilent Technologies) 4.6 × 250 mm column with 5 μm particles was used for separation. A binary gradient was used for extracts separation: A: 0.01 M solution of phosphoric acid; B: methanol – start with 100% A, linear gradient to 95% A in 1.5 minutes, stable up to 2nd minute, linear decrease to 83% A in 3rd minute, stable up to 23rd minute, linear decrease A to 74% up to 30th minute, stable up to 35th minute, linear decrease A to 30% in 45th minute. Column was flushed for 7 minutes with methanol and afterwards equilibrated for 10 minutes with 100% A. External standard procedure was used for phenolic acids quantification. Samples of wine were filtrated before injection on HPLC.
Limit of Detection (LOD) and Limit of Quantification (LOQ) of selected phenolic acids.
| Number | Phenolic acid | LOD mg/kg | LOQ mg/kg |
|---|---|---|---|
| 1 | 3,4 pHydroxybenzoic acid | 0.45 | 1.5 |
| 2 | 4-hydroxybenzoic acid | 0.29 | 0.9 |
| 3 | Chlorogenic acid | 0.82 | 2.7 |
| 4 | Vanilic acid | 0.57 | 1.9 |
| 5 | Caffeic acid | 0.48 | 1.6 |
| 6 | Syringic acid | 0.92 | 3.1 |
| 7 | p-Coumaric acid | 0.89 | 2.9 |
| 8 | Ferulic acid | 0.56 | 1.8 |
| 9 | Sinapic acid | 0.39 | 1.3 |
| 10 | 3,4,5 Trimetoxybenzoic acid | 0.32 | 1.1 |
| 11 | Salicylic acid | 2.3 | 7.9 |
| 12 | Gallic acid | 0.15 | 0.7 |
2.3. Isotope analysis
The samples were distilled using an automated distillation control system (ADCS, Eurofins/Nantes, France). Isotope ratio mass spectrometry (IRMS): The Austrian samples were measured for carbon isotopes by injecting the alcohol in a Flash HT elemental analyzer (ThermoFisher, Bremen, Germany) and the produced gas is flushed by continuous helium flow into a Delta V IRMS (ThermoFisher, Bremen, Germany). The other samples of distillates were analysed by EA 3028 HT, (Eurovector, Italy) connected to GVI Isoprime (GVI, UK). The oxygen isotope values of the Austrian samples were measured by equilibration method in a gas bench (ThermoFisher, Bremen, Germany) and the equilibrated CO2-gas is flushed by continuous gas flow into a Delta V IRMS (ThermoFisher, Bremen, Germany). The δ18O values of the other samples were measured by the original method based on equilibration of pure CO2, performed by automatic device GVI Aquaprep (GVI, UK), and analysed afterwards by Dual Inlet Isoprime IRMS (GVI, UK).
The results are expressed in the conventional σ-notation in ‰ with respect to the V-SMOW (Vienna-Standard Mean Ocean Water) and with respect to the V-PDB (Vienna-PeeDee Belemnite) standards for oxygen and carbon, respectively. The extended uncertainty of measurements of δ13C and δ18O were better than ± 0.5 and ± 1.0‰, respectively, for all laboratories. For quality control and comparability of the results identical or comparable certified standards and reference materials were analysed together with the wine samples.
Distillates obtained from ADCS system were further analysed on ethanol content by Karl-Fischer titration, and measured against TMU as internal standard by 2H-NMR spectroscopy (SNIF-NMR) on 400 MHz instrument equipped with deuterium probe and locked on fluorine (AVANCE III HD, Bruker, France). Extended uncertainty is better than ± 1 ppm on D/HI, and ± 1.8 ppm on D/HII.
2.4. Statistical analysis
To distinguish the wine samples according to the country of origin, multivariate statistical calculations employing methods of principal component analysis (PCA), principal component factoring (PCF) and canonical discriminant analysis (CDA) were performed by means of Unistat® 6.0 (Unistat, London, United Kingdom) statistical software, taking into consideration pH, sulphur dioxide and alcohol content, total and volatile acidity, TPC, TFC and TEAC values, colour characteristics and concentration of phenolic acids and flavonoids.
The recognisability of discriminant model was determined as the percentage of the correctly classified samples in the training data set.
For statistical analysis of the isotope and element concentration data the PCA, Cluster analysis and factor analysis (FA) was used in the statistical software Statistica 12. The original data set contained 22 parameters. The first PCA identified 9 most influencing parameters.
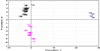 |
Figure 1. Canonical discriminant analysis of studied wine samples according to the country of origin (Austrian – AT, Czech – CZ, Serbian – SR). The SO2 and alcohol content, total and volatile acidity, pH, TPC, TFC, TEAC, colour characteristics, phenolic acids and flavonoids were used for discrimination. |
3. Results and discussion
The current study aims to unveil the possibilities for physico-chemical analyses for the differentiation and correct classification of wine from different sides of (and close to) a border, specifically the Austrian-Czech-Slovak border region. First preliminary results: The discrimination of samples according to the country of origin by means of CDA using the SO2 and alcohol content, pH, total and volatile acidity, TPC, TFC, TEAC, colour characteristics, phenolic acids and flavonoids as discriminators possessed 100% correctness (Fig. 1). Interestingly this evaluation for geographic origin does not differentiate at all between red and white wine samples.
Factor analysis performed with elemental and isotopic parameters differentiated the Slovak wines from the Austrian and Czech regions. The differentiations between Austrian and Czech wines is not complete and some overlap is observed (Fig. 2).
In conclusion, the currently only preliminary results give a surprisingly good differentiation of the investigated wine samples from the border regions. In the next vintages we aim to find sustainable patterns for the differentiation of geographic origin in this border area. Once these patterns (parameters and combinations of them) should be identified, they also need to be evaluated for their reasons to differ, as potential influences from the investigating laboratories need to be ruled out. Finally, the identified and evaluated patterns need to be tested for further vintages and by classifying samples that do not belong to the sample set.
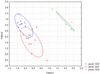 |
Figure 2. Diagram of the first and second Factors derived from factor analysis for differentiation of origin for Austrian, Czech and Slovak samples. |
Acknowledgments
Collection of Austrian wine samples by the Bundes-kellereiinspektion is thankfully acknowledged. We are thankful to K. Pischinger for vinification of the Austrian samples and to E. Riegler for processing of the Austrian wine samples and isotope measurements. Special thanks to I. Ludvíková and M. Vajčner from the Czech Institute for Supervising and Testing in Agriculture in Brno/Znojmo who collected with the assistance of Moravian wine-growers Czech samples and vinified them. For expertise and discussion we thank T. Vranova.
References
- Compendium of International Methods of Analysis of Wines and Musts Vol. 1 and 2, International Organisation of Vine and Wine (OIV), 2018 issue includes Resolution adopted in Sofia (Bulgaria). OIV – 18, Rue D'aguesseau – 75008 Paris http://www.oiv.int/oiv/info/enmethodesinternationalesvin [Google Scholar]
- Official Methods of Analysis of the AOAC, 14th edn. (Arlington, AOAC, 1984) [Google Scholar]
- A. Chaovanalikit, R.E. Wrolstad, J. Food Sci. 69, FC67 (2004) [Google Scholar]
- K. Pallab, K.T. Barman, K.P. Tapas, K. Ramen, J. Drug Delivery Therapeutics 3, 33 (2013) [Google Scholar]
- B. Tobolková, M. Polovka, E. Belajová, M. Korenovská, M. Suhaj, Eur. Food Res. Technol. 239, 441 (2014) [Google Scholar]
All Figures
|
Figure 1. Canonical discriminant analysis of studied wine samples according to the country of origin (Austrian – AT, Czech – CZ, Serbian – SR). The SO2 and alcohol content, total and volatile acidity, pH, TPC, TFC, TEAC, colour characteristics, phenolic acids and flavonoids were used for discrimination. |
| In the text | |
|
Figure 2. Diagram of the first and second Factors derived from factor analysis for differentiation of origin for Austrian, Czech and Slovak samples. |
| In the text | |
Current usage metrics show cumulative count of Article Views (full-text article views including HTML views, PDF and ePub downloads, according to the available data) and Abstracts Views on Vision4Press platform.
Data correspond to usage on the plateform after 2015. The current usage metrics is available 48-96 hours after online publication and is updated daily on week days.
Initial download of the metrics may take a while.