Open Access
Fig. 4
Download original image
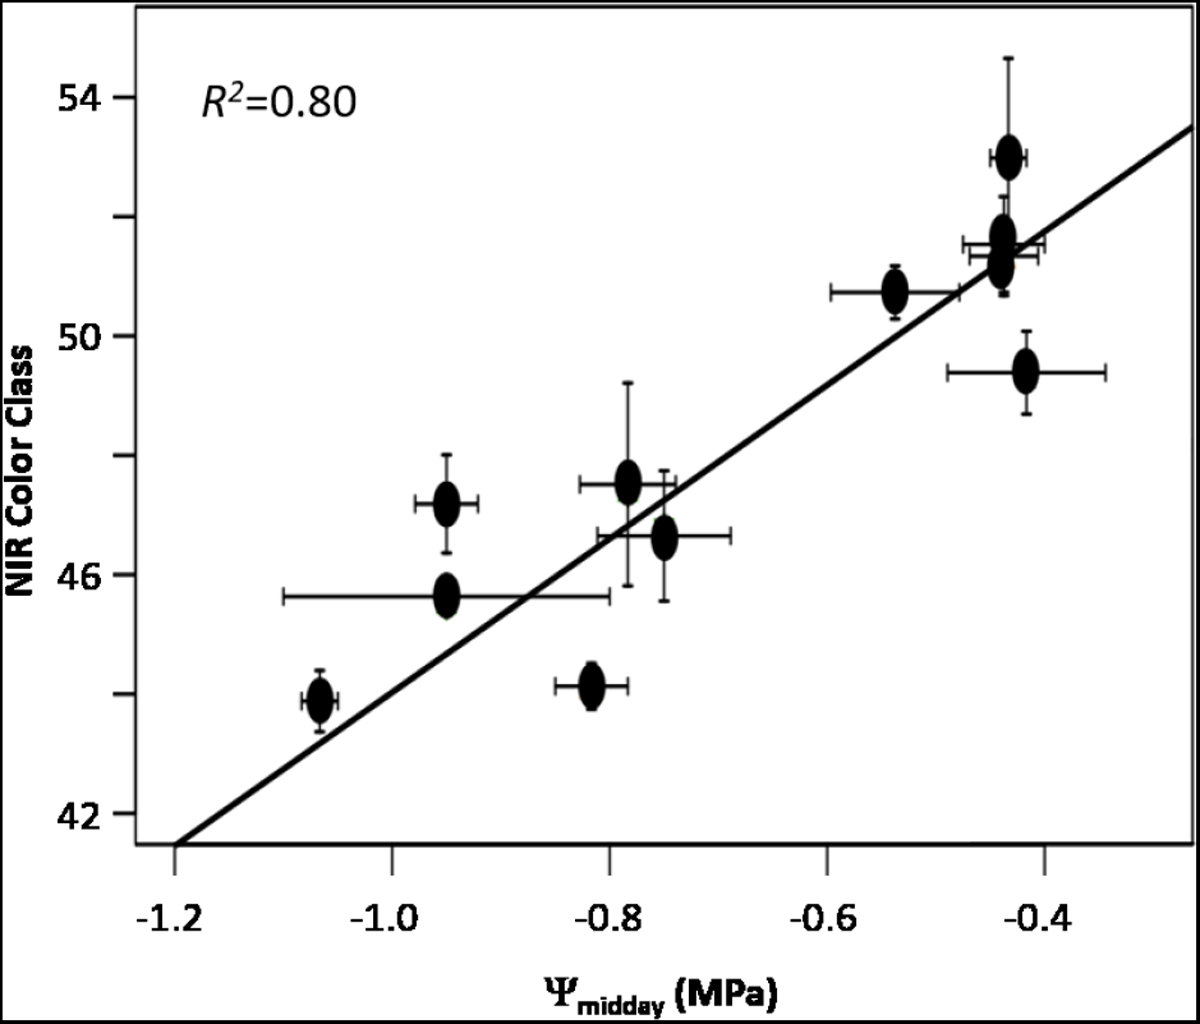
Linear regression between ψstem and NIR Color Class (R2=0.80) measured in all irrigation treatments at day 19 after drought imposition. Each point is the mean of 4-5 determinations collected throughout the experiment, bars are ±SE.
Current usage metrics show cumulative count of Article Views (full-text article views including HTML views, PDF and ePub downloads, according to the available data) and Abstracts Views on Vision4Press platform.
Data correspond to usage on the plateform after 2015. The current usage metrics is available 48-96 hours after online publication and is updated daily on week days.
Initial download of the metrics may take a while.