| Issue |
BIO Web Conf.
Volume 13, 2019
CO.NA.VI. 2018 - 7° Convegno Nazionale di Viticoltura
|
|
|---|---|---|
| Article Number | 02003 | |
| Number of page(s) | 4 | |
| Section | Site Selection and Precision Viticulture | |
| DOI | https://doi.org/10.1051/bioconf/20191302003 | |
| Published online | 01 April 2019 | |
Preliminary high-throughput phenotyping analysis in grapevines under drought
1
Università degli Studi della Basilicata − Dipartimento delle Culture Europee e del Mediterraneo, Italy
2
ALSIA Centro Ricerche Metapontum Agrobios, s.s. Jonica 106, km 448,2,
Metaponto,
MT
75010, Italy
* Corresponding author: This email address is being protected from spambots. You need JavaScript enabled to view it.
Abstract
This study reports correlative information between leaf water potential (ψ), total leaf area of draughted grapevines (Vitis vinifera L.) and non-destructive image analysis techniques. Four groups of 20 potted vines each were subjected to various irrigation treatments restoring 100% (control), 75%, 50% and 25% of daily water consumption within a 22-day period of drought imposition. Leaf gas exchanges (Li-Cor 6400), ψ (Scholander chamber), fluorescence (PAM − 2500), RGB and NIR (Scanalyzer 3D system, LemnaTec GmbH phenotyping platform) data were collected before and at the end of drought imposition. Values of ψ in severely stressed vines (25%) reached −1.2 MPa pre-dawn, in turn stomatal conductance and photosynthesis reached values as low as approx. 0.02 mol H2O m−2 s−1 and 1.0 μmol CO2 m−2 s−1, respectively. The high-throughput analysis preliminarily revealed a correlation between ψ (stem) and NIR Color Class (R2=0.80), and that plant leaf area might be accurately estimated through imagine analysis (R2=0.90).
© The Authors, published by EDP Sciences, 2019
 This is an Open Access article distributed under the terms of the Creative Commons Attribution License (http://creativecommons.org/licenses/by/4.0), which permits unrestricted use, distribution, and reproduction in any medium, provided the original work is properly cited.
1 Introduction
Precision agriculture is emerging as smart technology to assist in reducing environmental impact of agricultural practices and improving quality of products [1]. In this context, image analysis techniques will play a critical role in supporting precision farming irrigation scheduling.
Through the use of plant phenotyping platforms, it could be possible to study the effect of several abiotic stresses on plant growth and performance based on multi-spectrum high-throughput (HTP) image analysis in order to investigate some plant morphometric and physiological traits [2]. Among these, plant water status is a main factor that influences yield and quality in viticulture. However, its impact depends on timing, intensity and duration of drought [3, 4]. Classification and quantification of physiological and phenotypical plant traits could explain drought stress responses and assist in developing new tools for precision irrigation in a HTP domain.
Common methods for drought stress investigation are predominantly based on gathering information from traditional analysis using destructive methods (e.g., relative water content, leaf water potential, gas exchange analysis) or through in vivo plant sensors for measurements of physiological parameters (e.g., sap flow, leaf turgor pressure) [5, 6]. These methods are often time-consuming and poorly accessible in terms of required knowledge, Hence, friendly and more easy to access methods such as HTP ones are highly desirable for plant water status determination.
Based on this background, it appears that estimation of leaf water potential through HTP approach has not been adequately explored. Therefore the objective of this study was to examine whether leaf water potential of grapevines would be correlated to an HTP based index. For this purpose, a set of vines were subjected to drought and simultaneously monitored for physiological (e.g., leaf gas exchanges, water potential) and phenomic (e.g., spectral reflectance of leaf) traits.
Leaf area is also a key parameter for precision irrigation mainly because leaf is the transpiring organ that accounts for almost the whole plant transpiration. In addition, foliage influences water evaporation from soil because its potential shading. Therefore knowledge of leaf area at any time of plant growth might be relevant for plant water need determinations.
Leaf area estimate through nondestructive methods (e.g., digital biovolume) is mainly adopted for annual crops [7] while it is poorly adopted within perennials. Hence, this study also tested the application of the digital biovolume estimation procedure to grapevines.
2 Materials and methods
2.1 Experimental design and growing conditions
The experiment was carried out at the ALSIA ‘Metapontum Agrobios’ Research Center, located in Metaponto, Southern Italy (N 40° 23’ E 16° 47’) during the 2017 growing season.
A total of 80 3-year-old own-rooted vines (cv Aleatico) were grown in a 3.5 L PVC pot under unheated glasshouse conditions. The pots were filled with a 3:1 v/v mixture of sandy loam soil (82% sand, 7% silt and 11% clay) and peat. Pots were isolated with plastic film in order to minimize the evaporation of water from the bare soil.
From bud-break (early March) until the beginning of the experimental period, all vines were fully irrigated and fertilized with 3 g per pot of NPK 14.7.14 (Slowenne® 212, Valagro Spa, Atessa, Italy) at 15, 30 and 45 days after bud-break. The vines were weighed daily (evening) and 100% of the amount of daily water loss was added to keep soil moisture at field capacity.
At day 50 after bud-break, vines were grouped (×20 vines each) and the water stress imposed for approx. 20 days by restoring 100% (control), 75%, 50% and 25% of the daily water consumption. The potted vine weight of the previous day was used as a reference to determine daily water loss of each vine.
Air temperature, relative humidity and PAR were monitored by a standard weather station located inside the greenhouse. The air vapor pressure deficit (VPD) was then calculated from the records of air temperature and relative humidity, according to Goudriaan and van Laar [8].
Before (Day 0) and at day 19 after the imposition of drought the following determinations were performed (see below).
2.2 Leaf Gas exchanges
Net photosynthesis rate (Pn) and stomatal conductance (gs) were measured midday (11:30-12:30 h) using a portable photosynthesis system Li-Cor 6400 (Li-Cor, Inc., Lincoln, NE, USA), operating under prevailing ambient temperature and CO2 concentration; PAR inside the cuvette was stably maintained at 800 μmol m−2 s−1 and the operating flow rate at 500 μmol s−1.
The gas exchange measurements were performed on two fully expanded leaves from each plant, selected from the mid-region of the canopy and labelled at the beginning of the experiment.
2.3 Stem water potential
Concomitantly with leaf gas exchanges measurements, leaf water potential (ψ) was measured at midday (ψstem) using the Scholander pressure chamber (Model 600, PMS Instruments, Corvallis, OR) pressurized with N. For the ψstem measurements, leaves were covered with aluminum foil for at least 90 minutes before measurements were taken.
Pre-dawn leaf water potential (ψpre-dawn) was also measured (04:00 h) using the same procedure for ψstem without applying the aluminum foil. The measurements were performed on two fully expanded leaves per vine (opposite to those used for gas exchanges) using 4-5 vines per treatment.
2.4 Plant phenotyping measurements and imagine analysis
Following the pre-dawn and midday water potential measurements, images of plants were taken on the same vines. A set of images of each irrigation treatment was collected using the Scanalyzer 3D system (LemnaTec GmbH) phenotyping platform. Two imaging chambers equipped with different optical sensors, near infra-red (NIR) (Vosskühler GmbH NIR-300PGE), visible light (RGB) (Basler Scout scA1600-14gc) were employed. For each sensor type 3 images were acquired, one from above the plant (Top View) and 2 laterally at an orthogonal angle (Side View). The image segmentation and analysis were performed using the software LemnaGrid v5. The color class of each NIR image was obtained considering that the complete greyscale ranges from bin 0 (black, high water content) to bin 255 (white, low water content). The NIR color class was then calculated as the reciprocal weighted mean of the number of pixel in each bin class according to Petrozza et al., [9].
2.5 Chlorophyll a (Chl-a) fluorescence
The Chl-a fluorescence was measured midday on two leaves per vine (4-5 vines per treatment) using a portable chlorophyll fluorimeter PAM- 2500 (Heinz Walz GmbH, Effeltrich, Germany) on the tagged leaves used for leaf gas exchanges.
The fluorescence measurements were recorded after 30 min of dark adaptation using leaf clip DLC-8 Walz GmbH, Effeltrich, Germany. The basal (F0) and maximal (Fm) Chl-a fluorescence were collected by applying a brief saturating light pulse (5000 μmol m−2 s−1 PAR) and used to calculate the variable fluorescence (Fv=Fm-F0) and then the maximum quantum yield of photosystem (PS) II was calculated as Fv/Fm ratio [10].
2.6 Leaf area
On 3-4 vines per irrigation treatment, leaf area was measured with a LI-3100 leaf area meter (LI-COR, Lincoln, NE, USA). On the same vines, leaf area was also estimated through the Digital Biovolume using the areas of the vines as appear in the three orthogonal images collected by the RGB chamber [7].
2.7 Statistical analysis
The statistical analyses were performed using one-way analysis of variance (ANOVA), and the means were compared using the Duncan’s New Multiple Range Test (MRT; p<0.05) [9]. Statistics and graphical presentations employed R statistical computing environment [12].
3 Results and discussion
During the experiment, mean air temperature and RH were 22°C and 35-40%, respectivley. Daily values of VPD ranged from 0.5 (early morning) to 2.7 kPa (midday) when PAR peaked on average at 1200 μmol m2 s−1.
As expected, well irrigated vines (100%) showed roughly stable values of ψ around −0.2 (pre-dawn) and −0.4 (midday) MPa (Fig. 1). In all droughted vines both ψpre-dawn and ψstem significantly declined comprared to that of control vines, except for the ψpre-dawn of the 75% group which remained similar to that of control vines (Fig. 1A).
After an approx. 20-day period of drought imposition, gs and Pn significantly decreased in stressed vines compared to control ones (Fig. 2A and B) according to previous study in water relations [e.g., 12]. In addition, 50% and 25% showed the highest reduction in gs and Pn being in line with the lowest ψ they reached (Fig. 1).
The efficiency of PSII was not affected by the imposed drought stress conditions and remained close to 0.8 which is believed the threshold of photoinhibition [14, 15]. The Fv/Fm was stable across the experiment and treatments likely because of the protective role of the ABA (the main drought induced chemical signal) which increases under drought [16].
The response to drought of the various RGB and NIR colorimetric indexes obtained through the HTP was greatly variable (not shown). Figure 3 reports the changes of NIR Color Class recorded across the various irrigation treatments. A declining trend of NIR Color Class could be envisaged under increasing drought level, however it was statistically significant only at most severe one (i.e., 25%) after 19 days (Fig. 3). Several experiments have shown a good relation between NIR- based stress indices and the leaves water status, especially when harsh drought occurs [17, 18, 19]. Values of NIR Color Class measured in all irrigation treatments were linearly correlated with ψstem (Fig. 4). Such a close correspondence might be due to the change (reduction) in water content of leaves of droughted grapevines [17, 18, 19].
Estimated leaf area through the Digital Biovolume calculation was linearly correlated with the measured leaf area (not shown) with a coefficient of correlation R2=0.90. Hence, Digital Biovolume might be useful in HTP studies not only for annual crop [9] but also for perennial plants such as grapevines which have a more complex canopy architecture.
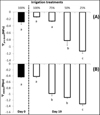 |
Fig. 1 Values of (A) pre-dawn leaf water potential and (B) midday stem water potential measured in well-watered (100%) and droughted (75%, 50%, 25%) grapevines before (DAY 0) and after (DAY 19) the imposition of drought. Each column represents the mean ± SE. Different letters indicate significant differences (P≤0.05, Duncan’s New Multiple Range Test). |
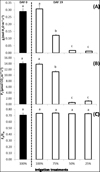 |
Fig. 2 Values of (A) stomatal conductance (gs mol m−2 s−1), (B) net photosynthetic rate (Pn, μmol m−2 s−1) and (C) efficiency of PSII (Fv/Fm) measured in leaves of grapevines under well-watered conditions (100%) and various drought levels (75%, 50%, 25%) at the beginning (DAY 0) and after 19 days of drought imposition Each column represents the mean ± SE. Different letters indicate significant differences (P≤0.05, Duncan’s New Multiple Range Test). |
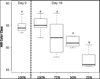 |
Fig. 3 Near Infrared Color Class recorded before drought imposition (DAY 0) and at day 19 after drought. Different letters indicate significant differences. (P≤0.05, Duncan’s New Multiple Range Test). |
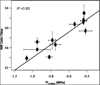 |
Fig. 4 Linear regression between ψstem and NIR Color Class (R2=0.80) measured in all irrigation treatments at day 19 after drought imposition. Each point is the mean of 4-5 determinations collected throughout the experiment, bars are ±SE. |
4 Conclusion
A correspondence between NIR Color Class and vine water status in grapevines (as assessed through Y stem) was presented. Results highlighted the potential of NIR Color Class to estimate Y at least under severe drought (25% irrigation treatment in this study). However, more detailed analyses are required to identify additional (colorimetric) HTP indices, that might strengthen the use of image analysis to assist in plant water status prediction and, in turn, in irrigation scheduling.
Based on correlative information gathered in this study, it might be concluded that the Digital Biovolume is a valuable proxy for the total leaf area estimation showing a good prospective in the use of this index also in perennial crops.
References
- A. Balafoutis, B. Beck, S. Fountas, J. Vangeyte, T. Wal, I. Soto, M. Gómez-Barbero, A. Barnes, V. Eory, Sustainability, 9, 1339 (2017) [CrossRef] [Google Scholar]
- R.T. Furbank, M. Tester, Trends in Plant Science 16, 635–644 (2011) [CrossRef] [PubMed] [Google Scholar]
- A. Herrero-Langreo, B. Tisseyre, J. M. Roger, T. Scholasch, Precision. Agric. 19, 365–378 (2018). [CrossRef] [Google Scholar]
- M. M. Chaves, et al., Ann. Bot. 105, 661–676 (2010) [CrossRef] [PubMed] [Google Scholar]
- F. Fiorani, U. Schurr, Annu. Rev. Plant Biol. 64, 267–291 (2013) [CrossRef] [PubMed] [Google Scholar]
- J.E. Fernández, Horticulturae, 3, 35 (2017) [Google Scholar]
- M. Eberius, J. Lima-Guerra, Bioinformatics 7, 259–278 (2009) [CrossRef] [Google Scholar]
- J. Goudriaan, H. H. Van Laar, Modelling potential crop growth processes: textbook with exercises 2 (2012) [Google Scholar]
- A. Petrozza, A. Santaniello, S. Summerer, G. Di Tommaso, D. Di Tommaso, E. Paparelli, A. Piaggesi, P. Perata, F. Cellini, Scientia Hortic. 174, 185–192 (2014) [CrossRef] [Google Scholar]
- K. Maxwell, G. N. Johnson, J. Exp. Bot. 51, 659–668 (2000) [Google Scholar]
- R Core Team, R: A language and environment for statistical computing. Austria https://www.R-proiect.org/ (2016) [Google Scholar]
- F. de Mendiburu, agricolae: Statistical Procedures for Agricultural Research. R package version 1.2-4. https://CRAN.R-proiect.org/package=agricolae (2016) [Google Scholar]
- J. Cifre, J. Bota, J.M. Escalona, H. Medrano, J. Flexas, Agr. Ecosyst. Environ. 106, 59–70 (2005) [Google Scholar]
- H. Medrano, J. Bota, A. Abadia, B. Sampol, J.M. Escalona, J. Flexas, Funct. Plant Biol. 29, 1197–1207 (2002a) [Google Scholar]
- G. Montanaro, B. Dichio, C. Xiloyannis Photosynthetica 47 (3), 363–371 (2009) [CrossRef] [Google Scholar]
- F.J. Berli, D. Moreno, P. Piccoli, L. Hespanhol- Viana, M.F. Silva, R. Bressan-Smith, J.B. Cavagnaro, R. Bottini, Plant Cell Environ. 33, 1–10 (2010) [PubMed] [Google Scholar]
- B. Berger, B. Parent, M. Tester, J. Exp. Bot. 201 (2010) [Google Scholar]
- J.U.H. Eitel, P.E. Gessler, A.M.S. Smith, R. Robberecht, Forest Ecol. Manag. 229, 170–182 (2006) [CrossRef] [Google Scholar]
- H.D. Seelig, A. Hoehn, L.S. Stodieck, D.M. Klaus, W.W. Adams, W.J. Emery, Int. J. Remote Sens. 29, 3701–3713 (2008) [Google Scholar]
All Figures
|
Fig. 1 Values of (A) pre-dawn leaf water potential and (B) midday stem water potential measured in well-watered (100%) and droughted (75%, 50%, 25%) grapevines before (DAY 0) and after (DAY 19) the imposition of drought. Each column represents the mean ± SE. Different letters indicate significant differences (P≤0.05, Duncan’s New Multiple Range Test). |
| In the text | |
|
Fig. 2 Values of (A) stomatal conductance (gs mol m−2 s−1), (B) net photosynthetic rate (Pn, μmol m−2 s−1) and (C) efficiency of PSII (Fv/Fm) measured in leaves of grapevines under well-watered conditions (100%) and various drought levels (75%, 50%, 25%) at the beginning (DAY 0) and after 19 days of drought imposition Each column represents the mean ± SE. Different letters indicate significant differences (P≤0.05, Duncan’s New Multiple Range Test). |
| In the text | |
|
Fig. 3 Near Infrared Color Class recorded before drought imposition (DAY 0) and at day 19 after drought. Different letters indicate significant differences. (P≤0.05, Duncan’s New Multiple Range Test). |
| In the text | |
|
Fig. 4 Linear regression between ψstem and NIR Color Class (R2=0.80) measured in all irrigation treatments at day 19 after drought imposition. Each point is the mean of 4-5 determinations collected throughout the experiment, bars are ±SE. |
| In the text | |
Current usage metrics show cumulative count of Article Views (full-text article views including HTML views, PDF and ePub downloads, according to the available data) and Abstracts Views on Vision4Press platform.
Data correspond to usage on the plateform after 2015. The current usage metrics is available 48-96 hours after online publication and is updated daily on week days.
Initial download of the metrics may take a while.