Open Access
Fig. 3
Download original image
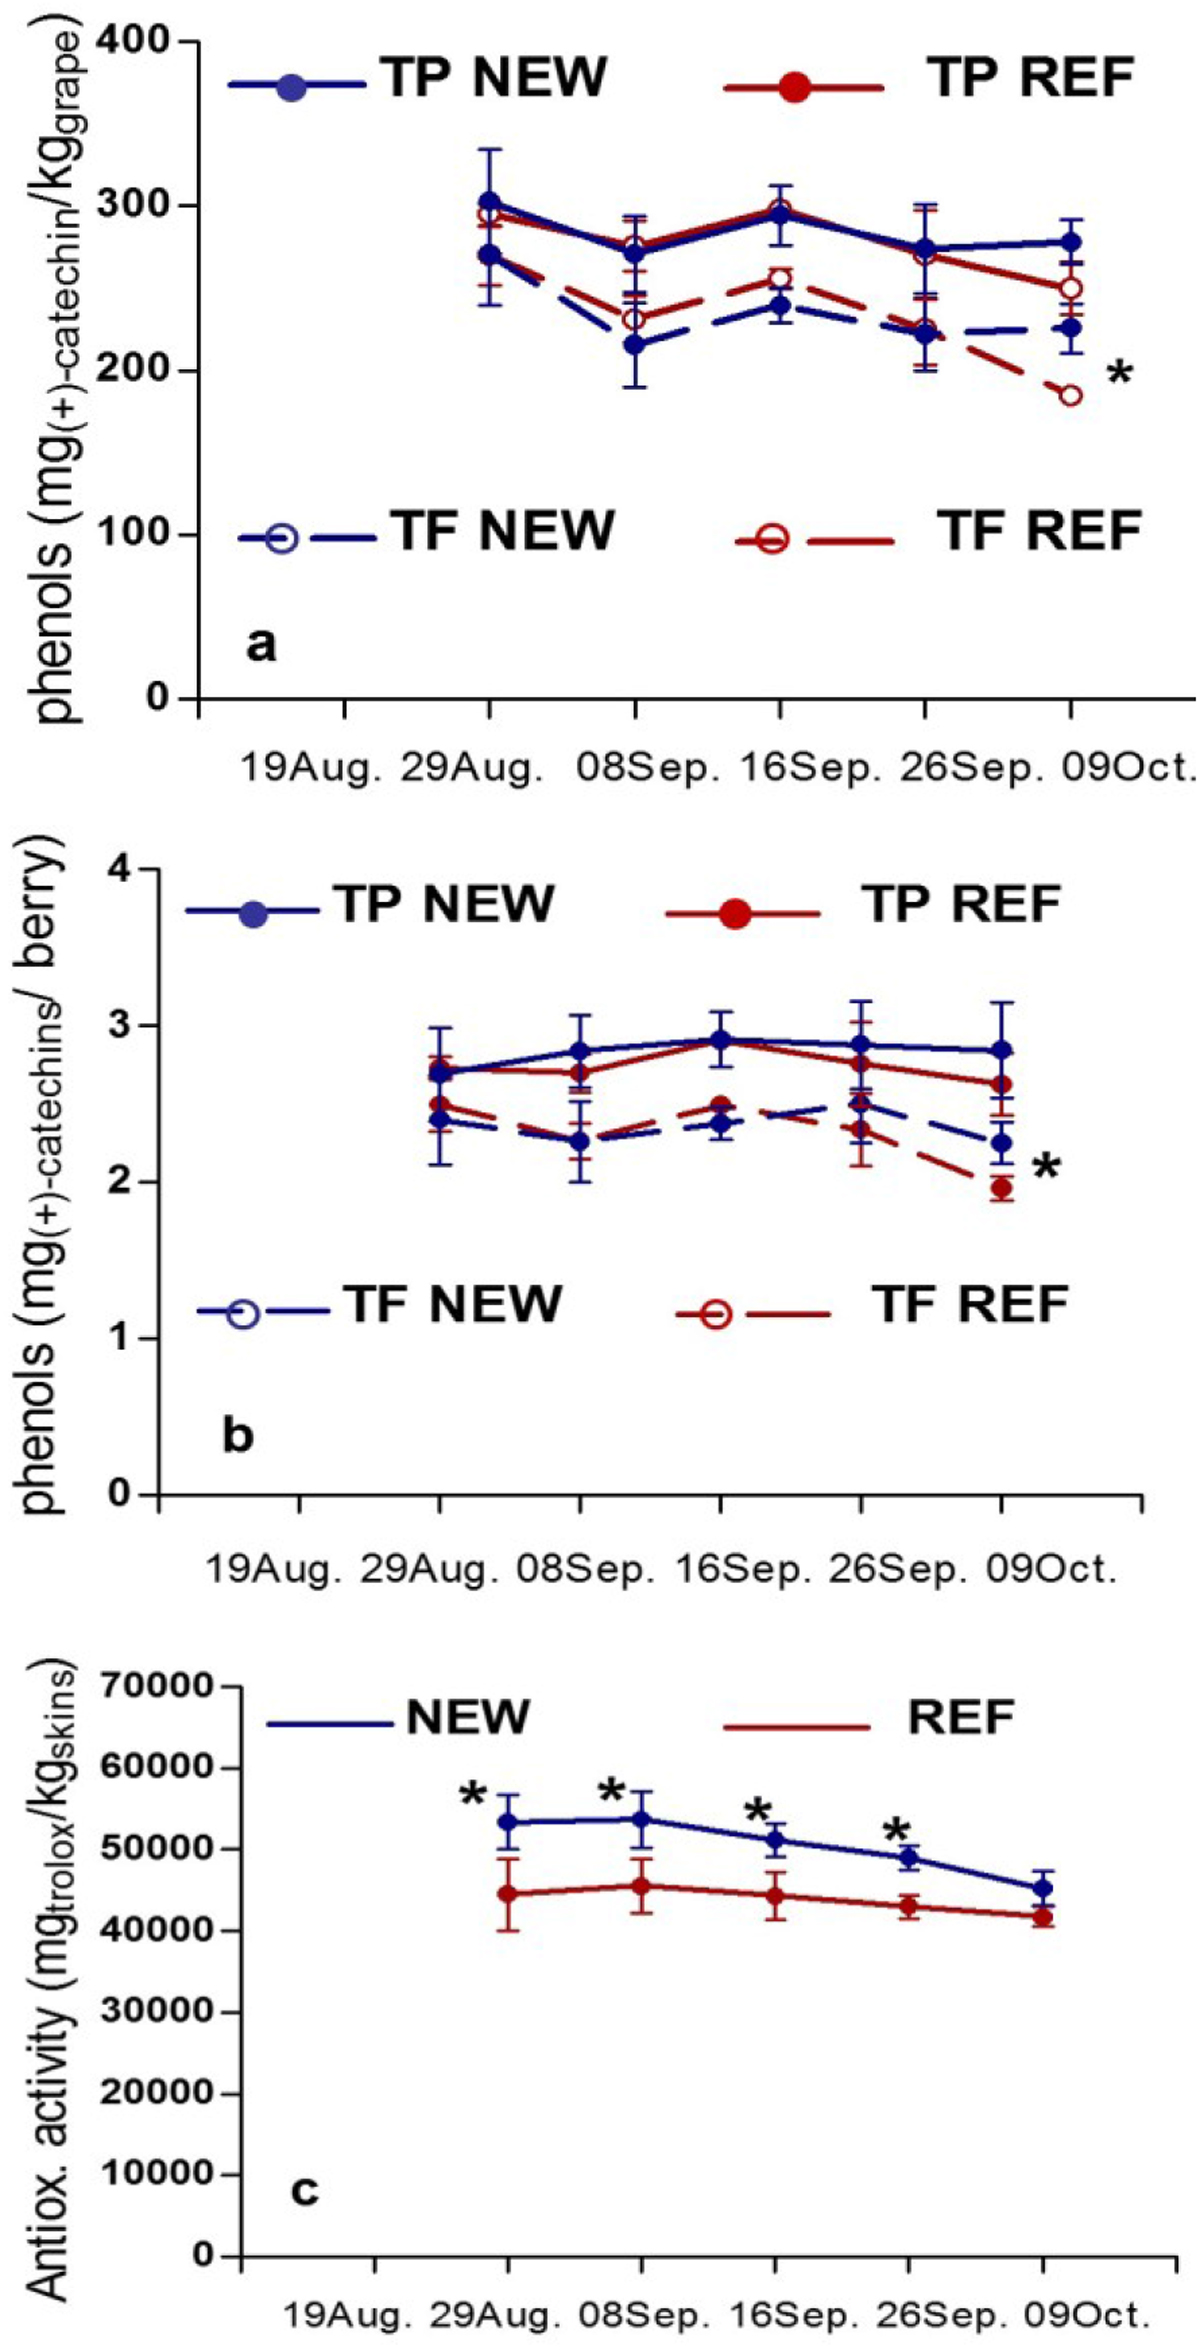
Evolution indices of berry skin TP and TF content per kilogram of grapes (a) or per single berry (b), and of AA in ‘late covered’ grape cv. Italia, according to type of plastic co ver (bars represent standard errors; * indicates sampling date where ANOVA F test was significant at p = 0.05).
Current usage metrics show cumulative count of Article Views (full-text article views including HTML views, PDF and ePub downloads, according to the available data) and Abstracts Views on Vision4Press platform.
Data correspond to usage on the plateform after 2015. The current usage metrics is available 48-96 hours after online publication and is updated daily on week days.
Initial download of the metrics may take a while.