| Issue |
BIO Web Conf.
Volume 68, 2023
44th World Congress of Vine and Wine
|
|
|---|---|---|
| Article Number | 01027 | |
| Number of page(s) | 7 | |
| Section | Viticulture | |
| DOI | https://doi.org/10.1051/bioconf/20236801027 | |
| Published online | 06 December 2023 | |
Cluster microclimate, canopy management and its influence on the berry (size and composition) quality
1 Investigador del CEIGRAM-UPM. Departamento de Producción Agraria. Universidad Politécnica de Madrid. Avenida Puerta de Hierro, 2, 28040 Madrid, Spain
2 enotecUPM, Chemistry and Food Technology Department. Universidad Politécnica de Madrid, Avenida Puerta de Hierro, 2, 28040 Madrid, Spain
Abstract
Sunlight and microclimate inside the clusters’ zone are key factors in berry development and must composition. Plant geometry and training system should be joined with a proper sunlight and temperature cluster microclimate and, also in the rest of the plant. Berry temperature can vary between 2 and 10 ºC or even more in inner clusters, depending on their exposure (Spayd et al., 2002). Sunlight, air ventilation within the canopy, temperature cluster and microclimate are affected by the exposure and radiation percentage received by grapes during its growth and maturation period (Deloire and Hunter 2005).
In Mediterranean conditions (warm and dry climate), the use of porous systems may help plants establish a better leaf distribution inside this area (de la Fuente et al., 2015), providing more space and enhancing certain physiological processes, both in leaves (photosynthesis, ventilation, transpiration) and berries (growth and maturation).
Grapes exposed to direct radiation are more sensitive to ripening and they can even suffer a dehydration process in the Mediterranean regions, where the temperature during the ripening after midday is frequently between 30-35 ºC or higher than 40 ºC (de la Fuente et al., 2015).
A key point for well microclimate management inside the canopy is heat flux control, which is usually generated by three factors: surface area (SA) to PAR (direct or indirect) radiation; intensity or thermal value (related to the temperature) and time of exposure (de la Fuente, 2009; de la Fuente et al., 2013). Sprawl systems are non-positioned systems where vegetation is in multidirectional directions. Therefore, as sun position changes along the day, some leaves are first shaded and then others, so the sun leaf exposure decreases (Gutiérrez et al., 2021).
The study was conducted in D.O. Uclés vineyards (lat. 39º50’8” N; long. 3º09’48.6” W; elevation 746 m above sea level) during the 2020 season, in cv. Tempranillo. The trial was designed with two training system: Vertical Shoot Positioned (VSP) and Sprawl (SP). Berry sampling was done every three days within the final 15 days before the estimated harvest date. A single sample comprised 100 berries collected from the clusters of the 10 selected vines in each block. Weight, size, must composition (reducing sugar, pH, acidity, volatile acidity, etc.) and skin composition (total and acylated monomeric pigments, TPI) were analysed.
Regarding the berry composition, SP accumulated larger concentration of reducing sugars (+7.4%). No statistical differences were observed in the remaining oenological parameters measured in the berries between treatments. Nevertheless, inside total pigments and color parameters, TPI values reached significantly higher (+40%) in the SP vs VSP treatments. In the total concentration of pigments (including the acylated fraction) and pH, no differences were founded. Berry's weight and size showed some relevant differences between treatments. During the end maturity-harvest period, the berry weight (12-11%) and berry size (6-9%) were higher in SP treatment compared to VSP.
These results suggest that the SP systems can induce an increment of reducing sugars, and TPI and also, can modulate the berry weight and size, helping to control overripening and berry dehydration processes. Therefore, sprawl systems (SP) represent an alternative to VSP systems in warm areas for achieving an increment of pigments, as well as for better control of the accumulation of reducing sugars, without compromising the harvest yield (higher berry weight and size).
Key words: Sprawl / training system / berry composition / berry size / Tempranillo
© The Authors, published by EDP Sciences, 2023
 This is an Open Access article distributed under the terms of the Creative Commons Attribution License 4.0, which permits unrestricted use, distribution, and reproduction in any medium, provided the original work is properly cited.
1 Introduction
Plant geometry and training system should be joined with a proper sunlight and temperature microclimate in the clusters`area and, also in the rest of the plant. Berry temperature can vary between 2 and 10 ºC or even more in inner clusters, depending on their exposure (Spayd et al., 2002). Sunlight, air ventilation within the canopy, temperature cluster and microclimate are affected by the exposure and radiation percentage received during the growth and maturation period; this is the main factor in getting an optimum bunch microclimate, which can reduce the heterogeneity in the berry maturity process (Deloire and Hunter 2005). Sunlight and microclimate inside the clusters’ zone are key factors in berry development and must composition.
An adequate leaf exposure porosity and canopy density, as well as a certain degree of shading in clusters area (a key factor during the ripening) meaning adequate fruit exposure to sunlight, promotes wine quality, which can help to reach the objectives chosen by the vineyard and cellar managers (de la Fuente et al., 2013). Grapes exposed to direct radiation are more sensitive to ripening and they can even suffer a dehydration process in the Mediterranean regions when the temperature during the ripening after midday is frequently between 30 and 35 ºC or higher (40 ºC) (de la Fuente et al., 2015).
Excessive fruit exposure may increase phenol concentrations beyond desirable levels (Smart, 1990). Since fruit composition responses to microclimate are already evident by veraison, pre-veraison canopy microclimate likely has a significant impact on wine quality. High temperatures during berry development exert a negative effect on berry composition and wine quality (Palliotti et al., 2014). Among environmental factors, cluster exposure to the sun is one of the most influential factors affecting the flavonoid composition in grape berries, and this can be easily modified by canopy management practices (Brillante et al., 2018).
Grapevine canopy microclimate largely depends on the amount and distribution of leaf area per volume and its relationship with the above-ground climate. Photosynthetic photon flux density (PPFD), light quality (red: far red ratio (R: FR; 630/730 nm)), wind speed and evaporation rate are the climatic factors most influenced by grape canopies, whereas air temperature and humidity are much less attenuated. (Dry, 2000). The light microclimate of the renewal zone is important for yield expression because shading can reduce cluster initiation, bud break, fruit set and berry size (Smart, 1990). The light environment of the renewal zone plays a primary role in regulating shoots per node, bunches per shoot, weight per bunch and primary bud-axis necrosis (Dry 2000).
Canopy microclimate affects also flowering and fruitful behaviours in the grapevine. It appears that late spring is the critical period; adequate shading at this time has a greater effect on fruitfulness (Dry, 2000). Environmental factors, especially day length and temperature, also influence inflorescence initiation and its development (Shvarukov et al., 2003). Environmental factors, such as air temperature, light intensity, mineral nutrition, and water and nitrogen supply, have an impact on the formation of inflorescence primordia (Wang et. al., 2020).
Grapes are non-climacteric fruits and have two stages of berry growth separated by a lag phase concomitant to changes in berry size, consistency and composition (Brillante et al., 2018).
Cell division is also an essential factor in fruit organogenesis. Intense mitotic activity in the berry pericarp occurs during the first week after anthesis and cell division occurs only during the first 2 weeks after anthesis in the pericarp, except for the skin cells where divisions are observed up to 30 days after anthesis, just one week before the end of phase I (Ojeda et al. 2001; Fernandez et al., 2006). One month later, when cell divisions are completed, berry growth is mainly related to cell enlargement. Cell division and enlargement of the berry pericarp are the main points during phase I in berry development.
This is a critical period for berry development, in which, water deficits from flowering to veraison can strongly affect the final cell volumes (Ojeda et al. 2001). Moreover, general warming (high temperature) and water deficit can both also alter the balance of berry sensory traits through the acceleration of berry shrivelling and mesocarp cell death (Palliotti et al., 2014).
In Mediterranean conditions (warm and dry climate), the use of porous systems can help plants establish a better leaf distribution inside this area (de la Fuente et al., 2015), providing more space and enhancing certain physiological processes, both in leaves (photosynthesis, ventilation, transpiration) and berries (growth and maturation).
A key point for well microclimate management inside the canopy is heat flux control, which is usually generated by three factors: surface area exposed (SA) to PAR (direct or indirect) radiation; intensity or thermal value (related to the temperature) and time of exposure (de la Fuente, 2009). Several investigations have shown that optimal bunch microclimate is made of a prevalent regime of diffuse light broken by occasional sun flecks infiltrating the canopy from different directions. It is also well known that anthocyanins are negatively influenced by excessive heat (Spayd et al., 2002) and that temperatures exceeding 35 ºC can impair their synthesis and enhance their degradation (Mori et al., 2007), maintain bunches under a main regime of diffuse light can be an agronomical winning choice, such as single high-wire cordon (sprawl) (Palliotti et al., 2014).
Canopy splitting has shown beneficial effects on increasing budburst, fruitfulness and yield per vine (Dry, 2000). Divided systems give a higher yield because they give more bunches/plant, with similar average berry and bunches weight, but with more fertile buds, which translates into a high total number of bunches. Leaf removal and shoot positioning can also increase the yield (Hunter, 2000). The position of the removed leaves on the shoot (apical or basal) and the canopy management strategy adopted (defoliation or shoot trimming) differentially altered the fruitset (Mataffo et al., 2023).
The sprawling system aims to minimize undesirable effects like chlorophyll degradation and hydric stress in plants. It is a non-positioned system where vegetation is aligned producing a multidirectional shoot. Therefore, when the sun position changes, some leaves are first shaded and then others, so the sun exposure time of the leaves decreases. It has been demonstrated that the use of this technique is an alternative to supporting the sugar accumulation in grapes without affecting the phenolic compounds (Gutiérrez et al., 2021).
2 Materials and methods
The study was conducted in D.O. Uclés vineyards (lat. 39º50’8” N; long. 3º09’48.6” W; elevation 746 m above sea level) during the 2020 season, within the Tempranillo cv. The trial was designed with two treatments depending on the training system: Vertical Positioned System (VSP) and Sprawl (SP), in a randomize three block design with 50 vines per single plot, including border lines. In each block, 10 vines were tagged for berry sampling, including five vines were selected for microclimate monitoring.
Microclimate in bunch area
Electronic button sensors for temperature monitoring DS1921H-F5# and temperature and relative humidity tracking DS1923-F5# (Embedded Data Systems, Lawrenceburg, KY, USA) were placed at fruit cluster height, recording data once every 1800 s during the final maturation phase of the grapes. The data presented for microclimate monitoring is the average of 5 sensors per single plot.
Must composition
The pulp was crushed once the skin and seeds were removed. Then, 5 mL of must of each block per day was poured into 5 mL vials and centrifuged at 6500 rpm at 4 ºC for 3 minutes. Every measurement was done with 1 mL of supernatant. Must composition was determined using OenoFossTM (FOSS Iberia, Barcelona, Spain) with Fourier transform infrared spectroscopy (FTIR). The oenological parameters identified included organic acids, glucosides, amino and pH values.
Pigments and Total Polyphenols Index
The skins removed from the berry were kept at -18 ºC until freeze-dried with an Edwards Modulyo freeze-drier (Crawley, UK) for 48 h. Samples of 0.5 g were mixed with 0.5 g sterile sea sand and ground. The ground sample was extracted with 15 mL methanol solution (methanol/water/formic acid with a ratio 0.5:0.49:0.01 v/v/v). The extraction took place over 15 min and continuous mixing. The extract was transferred to a 25 mL volumetric flask and diluted with ultrapure water. The sample was centrifuged for 10 min at 4000 rpm and 4 ºC. Samples were kept at 4 ºC until the chromatographic analysis. HPLC vials with caps with 2 mL of extract filtered using methylcellulose 0.45 µm (Teknochroma, Barcelona, Spain) membranes were used for the determination of anthocyanins.
The chromatographic procedure that was followed is a modification of a previously reported method described (Gutiérrez et al., 2021) on the eluents’ gradient. HPLC-DAD was an Agilent Technologies series 1200 (Agilent Technologies, Palo Alto, CA, USA) chromatograph with a column RP Kinetex C18 (100 mm x 4.6 mm; 2.6 µm) (Phenomenex, Torrance, CA, USA). Two solvents were used: solvent A (water/formic acid 95:5 v/v) and solvent B (methanol/formic acid 95:5 v/v) with the following gradient of solvent B (1 mL/min): 25% to 50% from time 0 to 5 min; 50% from time 5 to 12 min; and 50% to 25% from time 12 to 15 min, until a steady state was reached. The injection volume was 4 µL. The quantification of pigments was based on an external standard of malvidin-3-O-glucoside (M3G), while the identification of pigments was based on the maximum wavelength observed for each peak and according to experimental data.
The total polyphenols index (TPI) was determined with a UV-visible spectrophotometer 8453 from Agilent Technologies (Agilent Technologies, Palo Alto, CA, USA) with a photodiode array detector and 1 mm path-length quartz cuvettes. The absorption at wavelength 280 nm to determine TPI was obtained from the samples using the sampling procedure defined for pigment extraction.
Berry weight and size
Berry sampling was done every three days during the final 15 days before the estimated harvest date. A single sample comprised 100 berries collected from the clusters of the 10 tagged vines in each block. All berries were measured along the axial axis to determine the size using a Vernier calibre and were subsequently weighed.
Statistical analysis
Determination of mean values, standard deviation, and analysis of variance (ANOVA). LSD and Duncan’s multiple range tests at 5% significance level were used to compare means among treatments (p < 0.05).
3 Results and Discussion
3.1 Microclimate conditions in bunch area
Data temperature and relative humidity changes were measured during the last 12 days before harvest (Fig. 1). This year, the monthly average temperature was higher than the historic one registered. Results show that SP system marks lower temperatures from morning to midday (10.00 s.t-14.00 s.t) between 0.5 and 1.0 ºC, but similar or lower temperatures (<0.5 ºC) during the afternoon and evening every day, which is quite interesting for keeping the best polyphenols and flavour profiles inside the berry skin. Even if there were slight differences in daily temperatures, the accumulated effect can be relevant depending on the maturity period conditions (extremely warm this year).
On the contrary, the relative humidity records in SP treatment were higher from morning to midday (10.00 s.t-14.00 s.t), between 1 and 2.5%, and similar or lower during the afternoon (<0.5%), which is also interesting for maintaining under control the DVP in the plant.
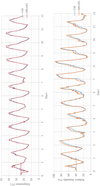 |
Figure 1 Daily cluster microclimate continuously daily measured in both treatments between veraison and harvest for temperature (ºC) and Relative Humidity (%RH). |
3.2 Must composition
Tempranillo cultivar showed statistical differences between the VSP and SP regarding the concentration of reducing sugars. SP accumulated a larger concentration of reducing sugars (+7.4%) compared with VSP.
Our results are in line with previous studies (de la Fuente et al., 2015) when the climate conditions are really warm at the cluster area, sprawls go on with physiological activity (photosynthesis, transpiration, stomatal conductance, etc.) and do not rise to an embolic process due to high temperature reached by the canopy, unlike the VSP. Sugar accumulation depends on the environmental conditions and therefore, the grapevine microclimate and when the conditions are less extreme, a minimal modification of the canopy should lead to a slowdown in sugar accumulation (Gutiérrez et al., 2021).
Even if acid accumulation of malate and other metabolites such as aspartate and maleate, tends to be reduced in berries more exposed to sunlight, no differences were recorded between treatments related both acidity and pH.
Accordingly, no statistical differences were observed in the remaining oenological parameters measured in the berries.
3.3 Pigments and total polyphenols index
Total pigments content was not affected by canopy management (Table 2), including acylated monomeric content fraction, which were slightly higher in SP instead of VSP (tendency). Only the total polyphenols index (TPI) reached significantly higher (+40%) values in the SP vs. VSP treatments. These results are in line with previous studies (de la Fuente et al., 2015; Brillante et al., 2018) where in an extremely hot season, a higher pigment concentration (mainly anthocyanins) was observed in the SP treatments compared to VSP, due to less solar degradation process in the berry.
Oenological parameters 1. Comparison of blocks under different canopy management systems (Vertical Shoot Positioned-VSP vs Sprawl-SP).
Total phenolic compounds and colour parameters (UV-Vis) and main anthocyanins (HPLC-DAD)2. Comparison of blocks under different canopy management systems (Vertical Shoot Positioned-VSP vs Sprawl-SP).
3.4 Berry weight and size
Berry's weight and size showed some relevant differences between treatments. During the whole maturity-harvest period, the berry weight (12-11%) and berry size (6-9%) were higher in SP treatment compared to VSP (Table 3) depending on the date, which means that during the end of the maturity period, SP berries are bigger than VSP berries. There are two hypotheses for explaining that:
Higher mitotic division of the pericarp from anthesis until fruit set in SP systems than in VSP systems, which turns out into more layers and cells in the pericarp structure.
Less degradation (overripening, dehydration, etc.) processes in the skin form veraison to harvest in SP systems than in VSP systems.
Total pericarp cells increase from anthesis until the sum of average daily temperature (10 ºC) reached 350 ºC·DD (close to 19 days before veraison), meaning the end of the mitotic period, and the division period usually ends at 340 ºC·DD. (Ojeda et al., 2001). The cellular division is not commonly affected by water deficit between anthesis and veraison, but the pericarp enlargement is usually affected, causing a reduction in cell volume, which is the main cause of reducing the final berry size (Ojeda et al., 2001, Fouquet et al., 2008). According to these studies, cell division and pericarp enlargement could be affected by temperature and bunch exposure to sunlight in the clusters’ area, and water availability may play a relevant role during the pericarp development.
More studies from anthesis to harvest should be carried out to better know this behaviour and maybe obtain further conclusions.
Yield partitioning for three treatments.
4 Conclusion
The application of canopy management should be carefully considered as it may not only influence production in the current season but could also have a carry-over effect on the potential yield components for the next season.
Light interception and temperature in bud areas are key points to define grapevine bud fruitfulness, number of inflorescences primordia, etc., and they could be affected by canopy management practices (e.g. leaves and clusters sunlight exposure). Berry development could be also, because these results suggest that the SP systems can induce an increment of reducing sugars, TPI and also, can modulate the berry weight and size, helping to control overripening and berry dehydration processes.
Therefore, sprawl systems (SP) represent an alternative to VSP systems in warm areas for achieving an increment of pigments, as well as for better control of the accumulation of reducing sugars, without compromising the harvest yield (higher berry weight and size).
Mechanisms for explaining the higher volume and weight in berry development found in SP treatments (especially in hot seasons) should be further studied under a physiological approach.
This research was funded by the European Regional Development Fund (ERDF) through the National Smart Growth Operational Programme FEDER Innterconecta, grant number EXP-00111498/ITC-20181125. Project Freshwines. Special gratitude to Universidad Politécnica de Madrid (UPM) and particularly, Enotec and Viticultura research groups from ETSIAAB.
References
- Spayd S., Tarara J., Mee D.L., Fergurson J.C. Separation of sunlight and temperature effects on the composition of Vitis vinifera cv. Merlot berries. American Journal of Enology and Viticulture 53(3), 171–182 (2002) [CrossRef] [Google Scholar]
- Deloire A., Hunter J.J., Microclimat des grappes et maturation du raisin. Le Progrès Agricole et Viticole 122, 151-157 (2005) [Google Scholar]
- De la Fuente, M.; R. Linares; P. Junquera; B. Sebastián and J.R. Lissarrague (2015). “Cluster microclimate (light and thermal) is a key point of grape maturity in Mediterranean semiarid conditions. Actas XIXth Internacional Giesco Symposium. (Montpellier, France), 1-4p. [Google Scholar]
- De la Fuente, M. (2009), Caracterización geométrica, ecofisiológica y evaluación agronómica de sistemas continuos de vegetación libre (SPRAWL) vs. espaldera para atenuar la sobreexposición de hojas de racimos en cv. syrah (Vitis vinifera L.) en viñedos de zonas cálidas. Tesis doctoral. E.T.S.I.A. Producción Vegetal: Fitotecnia. Madrid. Universidad Politécnica de Madrid, 301 p. [Google Scholar]
- De la Fuente, M.R., Linares, P. Baeza and J.R. Lissarrague “Importance of canopy porosity into vineyard and the relationship with the grape maturity. Digital estimation method”. Ciência e Técnica Vitivinícola 28, 633-638 (2013) [Google Scholar]
- Gutiérrez, N., de- Silanes, L., Escott, C., Loira, I., del Fresno, J.M., Lepe, J.A., Morata, A. “The Effect of Elicitors and Canopy Management in the Chemical Composition of Vitis vinifera Red Varieties in Warm and Hot Areas in Spain”. Agronomy, 11, 1192 (2021) https://doi.org/10.3390/agronomy11061192 [CrossRef] [Google Scholar]
- Smart, R.E., Dick, J.K., Gravett, I.M, and B.M. Fisher (1990). “Canopy Management to Improve Grape Yield and Wine Quality Principles and Practices”. S. Afr. J. Enol. Vitic. 11(1), 3–17 [Google Scholar]
- Palliotti, A., Tombesi, S., Silvestroni, O., Lanari, V., Gatti, M., and S. Poni (2014). “Changes in vineyard establishment and canopy management urged by earlier climate-related grape ripening: A review”. Scientia Horticulturae 178, 43-54 (2014) [CrossRef] [Google Scholar]
- Brillante, L., MartínezLüscher, J., and S.K., Kurtural (2018). “Applied water and mechanical canopy management affect berry and wine phenolic and aroma composition of grapevine (Vitis vinifera L., cv. Syrah) in Central California”, Scientia Horticulturae 227, 261-271 (2018) [CrossRef] [Google Scholar]
- Dry, P., “Canopy management for fruitfulness”. Aust. J. Grape Wine Res. 6, 109-115 (2000) [CrossRef] [Google Scholar]
- Shavrukov, Y.N., Dry, I.B., and M.R. Thomas “Inflorescence and bunch architecture development in Vitis vinifera L”, Aust. J. Grape Wine Res. 10, 116-124 (2003) [Google Scholar]
- Wang, X., Lesefko, S., De Bei, R., Fuentes, S., and C. Collins, “Effects of canopy management practices on grapevine bud fruitfulness”, OENO One 2020 54(2), 313–325 (2020) [Google Scholar]
- Ojeda, H., Deloire, A. and A. Carbonneau” Influence of water deficits on grape berry growth”. Vitis 40(3), 141–145 (2001) [Google Scholar]
- Fernandez, L., Pradal, M., Lopez, G., Berud, F., Romieu, C., and L., Torregrosa “Berry size variability in Vitis vinifera L.” Vitis 45(2), 53–55 (2006) [Google Scholar]
- Mori, K., Goto-Yamamoto, G., Kitayama, M., Hashizume, K., Loss of anthocyanins in red-wine grapes under high temperature. J. Exp. Bot. 58, 1935-1945 (2007) [CrossRef] [PubMed] [Google Scholar]
- Hunter, J.J., “Implications of seasonal canopy management and growth compensation in grapevine”. S.Afr. J. Enol. Vitic. 21(2), 81–91 (2000) [Google Scholar]
- Mataffo, A., Scognamiglio, P., Molinaro, C., Corrado, G., and B. Basile “Early Canopy Management Practices Differentially Modulate Fruit Set, Fruit Yield, and Berry Composition at Harvest Depending on the Grapevine Cultivar”. Plants 12(733), 1–12 (2023) [CrossRef] [PubMed] [Google Scholar]
- Fouquet, R., Léon, C., Ollat, N., and F. Barrieu “Identification of grapevine aquaporins and expression analysis in developing berries”. Plant Cell. Rep. 27, 1541-1550 (2008) [CrossRef] [PubMed] [Google Scholar]
All Tables
Oenological parameters 1. Comparison of blocks under different canopy management systems (Vertical Shoot Positioned-VSP vs Sprawl-SP).
Total phenolic compounds and colour parameters (UV-Vis) and main anthocyanins (HPLC-DAD)2. Comparison of blocks under different canopy management systems (Vertical Shoot Positioned-VSP vs Sprawl-SP).
All Figures
|
Figure 1 Daily cluster microclimate continuously daily measured in both treatments between veraison and harvest for temperature (ºC) and Relative Humidity (%RH). |
| In the text | |
Current usage metrics show cumulative count of Article Views (full-text article views including HTML views, PDF and ePub downloads, according to the available data) and Abstracts Views on Vision4Press platform.
Data correspond to usage on the plateform after 2015. The current usage metrics is available 48-96 hours after online publication and is updated daily on week days.
Initial download of the metrics may take a while.