Open Access
Fig. 3
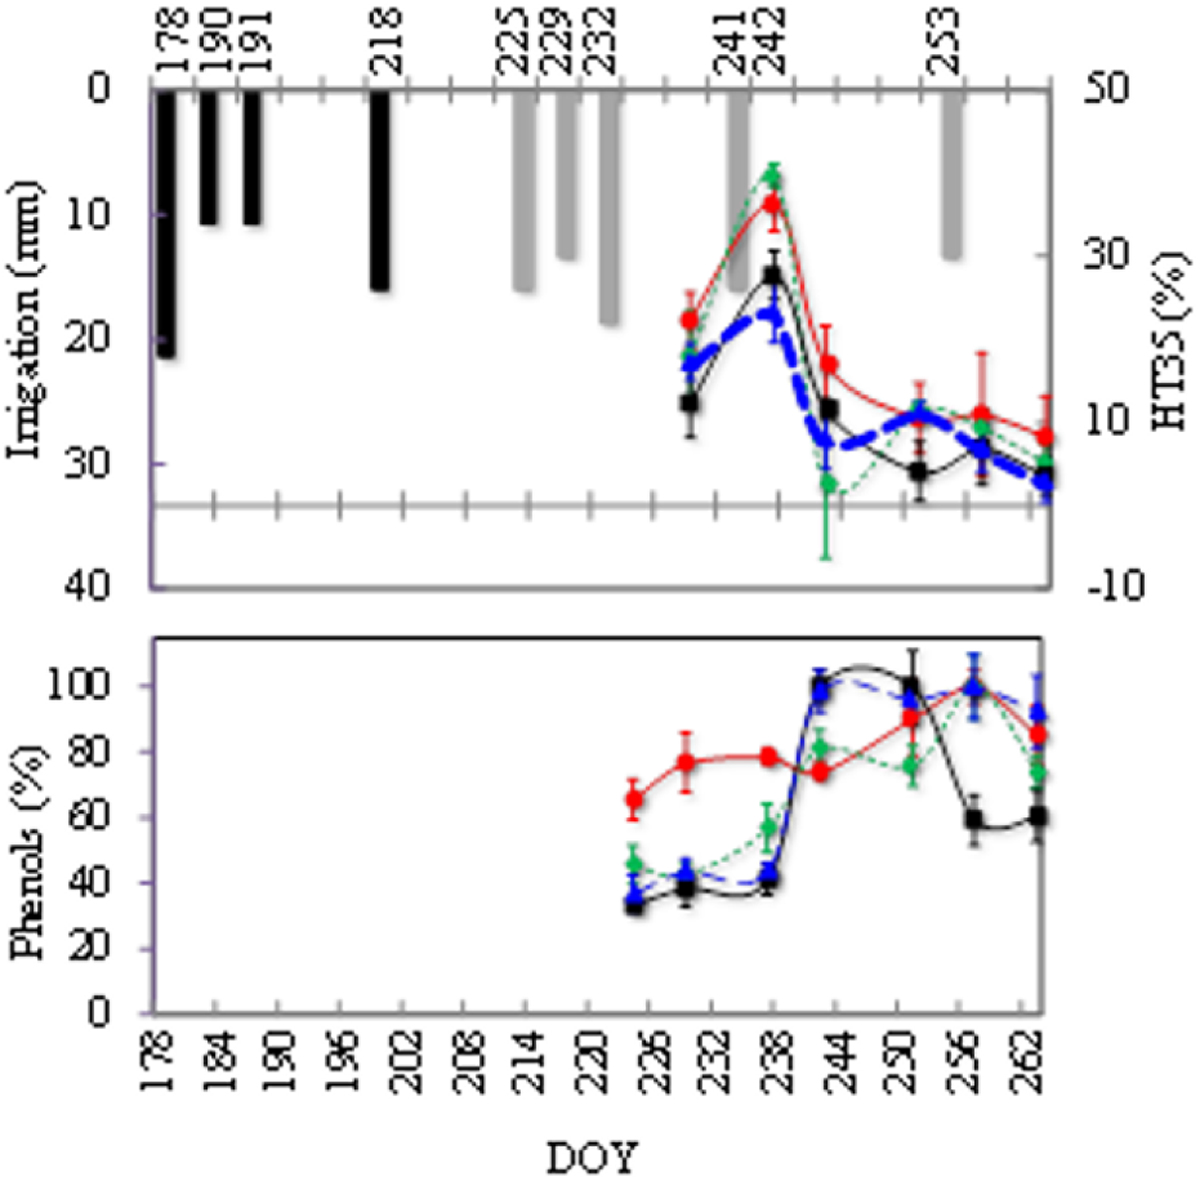
Download original image
Irrigation supplied in pre (fx9) and post-veraison (fx10); variation HT35 (%) in the timeframes between ripening controls and berry phenols (% of maximum content) among treatments (fx11 NC, fx12 ED, fx13 IC and fx14 LD). Mean (n=6) ± SE.
Current usage metrics show cumulative count of Article Views (full-text article views including HTML views, PDF and ePub downloads, according to the available data) and Abstracts Views on Vision4Press platform.
Data correspond to usage on the plateform after 2015. The current usage metrics is available 48-96 hours after online publication and is updated daily on week days.
Initial download of the metrics may take a while.