| Issue |
BIO Web Conf.
Volume 17, 2020
International Scientific-Practical Conference “Agriculture and Food Security: Technology, Innovation, Markets, Human Resources” (FIES 2019)
|
|
|---|---|---|
| Article Number | 00103 | |
| Number of page(s) | 6 | |
| DOI | https://doi.org/10.1051/bioconf/20201700103 | |
| Published online | 28 February 2020 | |
Studies on genes expression pattern of antioxidant enzymes and enzymes involved into the genetic information implementation in E.coli cells due to the antibiotic resistance against apramycin and cefatoxime
1
L.K. Ernst Federal Scientific Institute of Animal Husbandry, 142132 Moscow, Russia
2
Federal Scientific Research Veterinary Institute of Pathology, Pharmacology and Therapy of the Russian Agricultural Academy, 394087 Voronezh, Russia
3
Federal Research and Technology Institute of Biological Industry, 141142 Moscow, Russia
4
Kuban State Agrarian University named after I. T. Trubilin, 350044 Krasnodar, Russia
5
Voronezh State University, 394018 Voronezh, Russia
* Corresponding author: This email address is being protected from spambots. You need JavaScript enabled to view it.
Abstract
The emergence of antibiotic-resistant bacteria is considered a serious problem. The resistance of bacteria against antimicrobial substances becomes important in the repair systems for damage to DNA and RNA molecules. The role of the antioxidant system in the development of bacterial resistance against antibiotics is not yet practically studied. The article studied the expression regulation of the genes of antioxidant enzymes and enzymes involved in the genetic information in E. coli cells with the antibiotic resistance against apramycin and cefatoxime. The study was conducted on bacterial cells resistant against these two antibiotics. The genes blaOXA-1, blaSHV, blaTEM, mdtK, aadA1, aadA2, sat, strA, blaCTX, blaPER-2, tnpA, tnpR, intC1 and intC1c were identified in bacterial cell case. This indicates the presence of plasmids in bacteria with these genes, which provide bacterial resistance to apramycin and cefatoxime. It was established that during the formation of cefotaxime resistance, there was a sharp increase in the expression of the Cu, Zn superoxide dismutase gene: in comparison with the control group, the representation of its transcripts increased 141.04 times for cefotoxime and 155.42 times for apramycin. It has been established that during the formation of resistance to the studied antibiotics in E. coli, an increase in the expression of the end4 and end3 genes is observed. There is tendency toward an increase in the number of transcripts of the pol3E gene observed in the formation of resistance against cefotaxime and apromycin.
© The Authors, published by EDP Sciences, 2020
 This is an Open Access article distributed under the terms of the Creative Commons Attribution License 4.0, which permits unrestricted use, distribution, and reproduction in any medium, provided the original work is properly cited.
1 Introduction
There is a wide circulation of microorganisms with multidrug resistance developed recently. This is already a matter of human biological safety [1]. The main factors contributing to the emergence of antibiotic-resistant bacteria is an excessive consumption in the treatment of various diseases, as well as the use of antibiotics in animal husbandry [2]. At the same time, the time of emergence of resistance to new antibacterial drugs was significantly reduced [3, 4]
Several researchers report that the main reason for the formation of bacterial resistance to many antimicrobial agents used is the production of R plasmids when conjugated from other bacteria [5–8], which contain antibiotic resistance genes. They can be transmitted from one bacterium to another, forming resistance in the entire population. Antimicrobial resistance genes are present to varying degrees in most microorganisms, even in strains not previously exposed to antibiotics [9]. Staphylococci and streptococci isolated from pigs can quickly become resistant against the most antibiotics used in veterinary practice [10, 11]. The rapid development of resistance in pasteurella against erythromycin [12] and beta-lactam antibiotics [13] is established.
The resistance of bacteria against antimicrobial substances is mostly affected by the repair systems of damage to DNA and RNA molecules. The gyrase inhibitors induce the development of oxidative stress and cell death in E. coli [14]. There is an immense importance of functioning and regulation of the expression of various nucleic acid enzymes, such as endonuclease IV, exonuclease III, DNA polymerase I, as well as many regulatory elements, such as SoxRS, OxyR, MetR, and some others [15].
The emergence of resistance at the molecular level most often consists in the modification of enzymes that are targets of antibiotics and targets inside cells, the transformation of antibiotic molecules and the implementation of cellular metabolism reactions [16]. The antioxidant system in the developing antibiotic resistance in bacteria. The most commonly studied processes of oxidative stress in bacterial cells that have been exposed to antibiotics is not yet relevant.
Therefore, there is an important study of free radical oxidation processes and antioxidant protection in potentially pathogenic pathogens with the development of resistance to the main classes of antimicrobial substances and their compositions. Expression regulation of genes of antioxidant enzymes and DNA repair enzymes is one of the key steps in the control of free radical processes.
2 Materials and research methods
2.1 Objects of study
Laboratory studies were carried out on various clones of the strain E. coli 866. The list of studied material is – initial culture, as well as cultures after 40 and 20 passages in meat-peptone broth (MPB) containing increasing subbacteriostatic concentrations of apramycin and cefotaxime.
2.2 Antibiotic resistance formation
The study of drug resistance formation in E. coli was carried out in accordance with the “Guidelines for the experimental (preclinical) study of new pharmacological substances” [17] by cultivating bacteria in MPB containing increasing sub-bacteriostatic concentrations of the drug. The antimicrobial activity of the drugs against these microorganisms was studied by the serial dilution method after every ten passages. The degree of resistance of passivated bacterial cultures to the preparation was evaluated by the resistance coefficient – the ratio of the maximum concentration that does not interfere with the growth of bacteria to the initial one.
2.3 Plasmid DNA isolation
Isolation of plasmid DNA from bacterial cells was performed using microspin columns using the GeneJET Plasmid Miniprep Kit (plasmid DNA isolation kit) (Thermo Scientific, Lithuania) according to the manufacturer’s recommendations.
2.4 RNA Isolation
Total cellular RNA was isolated by phenol-chloroform extraction using guanidinoisocyanate as a chaotropic agent [18] followed by lysate purification on microspin columns using the GeneJET RNA Purification Kit (Thermo Scientific, Lithuania) according to the manufacturer’s recommendations. For the synthesis of the first strand of complementary DNA, recombinant reverse transcriptase of the Molony virus leukemia of M-MuLv mice was used.
The concentration of plasmid DNA and total RNA in the obtained samples was determined using a Quibit 2.0 fluorimeter (Invitrogen, USA) using the Quibit DNA assay kit and Quibit RNA assay kit (Invitrogen, USA).
The quality of the resulting preparations of total cellular RNA was evaluated using electrophoresis in 1 % agarose gel at a voltage of 5 V per centimeter of gel. 5 µl of RNA sample and 1 µl of dye were added to the gel wells to apply the sample. After electrophoresis, the gel was stained with 0.1 % ethidium bromide solution and viewed on a transilluminator at a wavelength of 365 nm. Analysis of restriction fragments was carried out on a 1.5 % agarose gel at a voltage of 5 V per centimeter of gel. Visualization of PCR products was carried out in a 2 % agarase gel.
2.5 Conducting RT-PCR
Quantitative PCR analysis was carried out using SYBR Green I fluorescent dye, Syntol reagent kits (Russia), a Bio-Rad CFX96 instrument (Bio-Rad, USA). For reverse transcription, 200 ng of total RNA was used. For PCR-RV, cDNA obtained using 10 ng of total cellular RNA was used as a template. As the normalizing gene, the 16S rRNA gene was used. Real-time polymerase chain reaction primers were developed using Primer3 software [19]. Search for nucleotide sequences homologous to xenobiotic biotransformation protein genes and resistance genes to various classes of E. coli antimicrobial agents in the GeneBank database was performed using the BLAST algorithm [20]. Amplification of fragments of the studied genes was carried out according to the scheme of a three-step polymerase chain reaction. The threshold cycle values were determined using the Bio-Rad CFX Manager 3.1 software (Bio-Rad, USA), and the relative expression level of the studied genes was determined using the 2-ΔΔCt- method [21]. Data normalization was carried out relative to the control group with the initial (sensitive) culture.
3 Results and discussion
To study the stability acquired by the resistance bacteria and restore their sensitivity to drugs, successive passages of microorganisms were carried out in the MPB containing no drug. The cultural-morphological and biochemical properties and sensitivity to the drugs were studied in every ten passages in bacteria. The results reflecting the antibiotic formation resistance are presented in Table 1.
Further experiment was made to identify resistance genes for β-lactams and aminoglycosides, as well as some regulatory sequences in plasmid DNA of E. coli 866 by polymerase chain reaction in the presence of intercalating dye SYBR Green I using primer pairs specific for blaOXA-1 genes, blaSHV, blaCMY-1, blaNDM1, blaCMY-2, blaTEM, blaPSE, mdtK, aadA1, aadA2, aadB, aphA1, ampR, sat, strA, strB, rmtB, armA, aphA3, blaCTX-M, tnpA, 2 tnpR, dha-1, int, intC1, intC1c, intC2 and intC2c. Primers were annealed at 60 °C.
The specificity of the reaction was evaluated by analyzing the melting curves and by considering the results of the polymerase chain reaction using electrophoresis in 2 % agarose gel.
As a result of the studies, the presence of E. coli 866 in plasmid DNA isolated from sensitive and resistant cultures of the blaOXA-1, blaSHV, blaTEM, mdtK, aadA1, aadA2, sat, strA, blaCTX-M, blaPER-2, tnpA genes was established tnpR, intCl, and intClc (Fig. 1–4).
Thus, there are the genes identified blaOXA-1, blaSHV, blaTEM, mdtK, aadA1, aadA2, sat, strA, blaCTX, blaPER-2, tnpA, tnpR, intC1 and intC1c. This indicates the presence of plasmids in bacteria with these genes, which are likely to provide bacterial resistance to apramycin and cefatoxime.
It was established that during the formation of resistance to cefotaxime to the fortieth passage, a sharp increase in the expression of Cu, Zn superoxide dismutase (SOD) occurred: in comparison with the control group, the representation of its transcripts increased by 141.04 times (Fig. 5).
A similar pattern of expression patterns of this group of genes was observed when apramycin resistance was formed (Fig. 6), with the only difference being that a sharp – 155.42-fold increase in the level of relative SOD expression was observed by passage 60.
It can be assumed that a sharp increase in the expression of SOD genes during the formation of resistance of E. coli to antimicrobial agents is a compensatory reaction to the oxidative stress arising under the influence of antibiotics in bacterial cells. Superoxide dismutase catalyzes the dismutation of superoxide into oxygen and hydrogen peroxide, while the reaction rate is limited only by the frequency of collision of the superoxide with the enzyme (diffusion-limited reaction), due to which SOD considers the main system protecting the cell from superoxide damaging effects.
Additional experiment was made to study the expression regulation of some elements in the functioning system of the genetic cell apparatus.
It was found that, during the formation of cefotaxime resistance, E.coli exhibits an increase in the expression of end4 and end3 genes (Fig. 7).
Their expression levels increased 11.31 and 3.63 times by the 60th passage. Moreover, significant changes in the expression of the bolA and treg genes encoding the BolA transcription regulator and the transcription regulator of genes responsible for multiple antibiotic resistance, respectively, were not found under these experimental conditions.
The formation of resistance against apramycin occurred in the background of increased transcription of endonucleases IV and III. By the 60th passage, the representation in the cell of their transcripts increased 6.77 and 1.62 times (Fig. 8), as shown in the picture when using cefotaxime.
At the same time, there was a tendency to a slight increase in the level of treg gene activity, which is apparently due to the fact that apramycin and cefotaxime belong to different classes of antibiotic drugs, and the formation of resistance to them at the basic level of action of substances involves various enzyme systems.
The tendency toward an increase in the expression level of the end4 gene encoding endonuclease IV, which occurred in all experimental groups according to the study is associated with the functional activity of this enzyme, which is important in oxidative stress conditions. Endonuclease IV considers an important system in DNA repair processes. It possesses 3’-diesterase activity providing restoration of DNA damage due to the oxidation of ROS. Thus, this increase in expression level is a response to increased damage to DNA molecules in oxidative stress under conditions.
The expression patterns of genes involved in DNA repair were studied. During the formation of cefotaxime resistance, a tendency towards an increase in the number of transcripts of the pol3E gene encoding the θ subunit of DNA polymerase III was observed. By the 40th passage, the level of its expression increased by 7.67 times, and by the 60th passage it was already 16.68 times compared with the control (Fig. 9).
In the formation of apromycin resistance, a tendency towards an increase in the number of transcripts of the pol3E gene was also observed. During the formation of resistance of E. coli 866 to apramycin, a slightly different picture of expression patterns of these genes was observed (Fig. 10).
The level of transcripts of the pol3E gene did not increase significantly – 2.68 times by the 60th passage compared to the control. However, there was a sharp increase in the level of expression of the hel4 gene– 85 times compared with the control at the 60th passage.
According to the previous result of the study gyrase inhibitors induce the oxidative stress development and cell death in E. coli [22]. Therefore, an increase in the representation of transcripts of this gene can be considered a compensatory reaction to the oxidative stress development in an invitro experiment.
Antimicrobial activity of apramycin and cefatoxime on E.coli cells
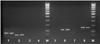 |
Fig. 1. The results of the polymerase chain reaction using primers for amplification of the gene fragments blaOXA-1 (1), blaSHV (2), blaCMY-1 (3), blaNDM1 (4), blaCMY-2 (5), blaTEM (6), blaPSE (7), mdtK (8). M is a DNA marker with a length of 50 bp + |
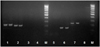 |
Fig. 2. The results of the polymerase chain reaction using primers for amplification of fragments of the genes aadA1 (1), aadA2 (2), aadB (3), aphA1 (4), ampR (5), sat (6), strA (7), strB (8) . M is a DNA marker with a length of 50 bp +. |
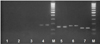 |
Fig. 3. The results of the polymerase chain reaction using primers for amplification of fragments of the rmtB (1), armA (2), aphA3 (3), blaCTX-M (4), blaPER-2 (5), tnpA (6), tnpR (7) gene fragments. M is a DNA marker with a length of 50 bp +. |
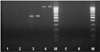 |
Fig. 4. The results of the polymerase chain reaction using primers for amplification of fragments of the dha-1 (1), int (2), intC1 (3), intC1c (4), intC2 (5), intC2c (6) genes. M is a DNA marker with a length of 50 bp +. |
 |
Fig. 5. Relative expression level of peroxidase, catalase, and SOD genes in E. coli 866 during the formation of cefotaxime resistance. Data normalized according to the control group |
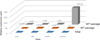 |
Fig. 6. Relative level of expression of peroxidase, catalase, and SOD genes in E. coli 866 during the formation of apramycin resistance. Data normalized relative to the control group |
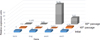 |
Fig. 7. Relative expression level of genes involved in the realization of genetic information in the cell in E. coli 866 with the development of cefotaxime resistance |
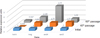 |
Fig. 8. Relative expression level of genes involved in the implementation of genetic information in the cell in E. coli 866 with the apromycin resistance development |
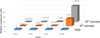 |
Fig. 9. Relative expression levels of helicase II and IV, as well as DNA polymerases I and III in E. coli 866 during the formation of cefotaxime resistance |
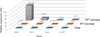 |
Fig. 10. Relative expression levels of helicase II and IV, as well as DNA polymerases I and III in E. coli 866 during the formation of apromycin resistance |
4 Conclusion
Thus, the research presents new study about the features of the course of free radical oxidation and antioxidant protection in potential pathogenies during the resistance development to the main classes of antimicrobial substances and their compositions. The study shows both the increase in the expression of antioxidant enzyme genes and the increase in the expression of enzyme genes involved in the realization of genetic information. This is an estimated adaptive response to the antibiotics reaction, which are likely to lead to oxidative stress of bacterial cells.
References
- I. Roca, M. Akova, F. Baquero, J. Carlet, M. Cavaleri, S. Coenen, J. Cohen, D. Findlay, I. Gyssens et al., New Microbes New Infect 6, 22–29 (2015) [PubMed] [Google Scholar]
- E. Castro-Sanchez, L. S. P. Moore, F. Husson, A.H. Holmes, BMC Infect. Dis. 16(1), 465 (2016) [CrossRef] [PubMed] [Google Scholar]
- Q. Chang, W. Wang, G. Regev-Yochay, M. Lipsitch, W.P. Hanage, Evol. Appl. 8, 240–247 (2015) [CrossRef] [PubMed] [Google Scholar]
- A.H. Holmes, L.S.P. Moore, A. Sundsfjord, M. Steinbakk, S. Regmi, A. Karkey, P.J. Guerin, L.J.V. Piddock, Lancet 387, 176–187 (2016) [CrossRef] [PubMed] [Google Scholar]
- P.M. Bennett, Br. J. Pharmacol. 153, 347–357 (2008) [CrossRef] [PubMed] [Google Scholar]
- S. Mizan, M.D. Lee, B.G. Harmon, S. Tkalcic, J.J. Maurer, J. Food Prot. 65(6), 1038–1040 (2002) [CrossRef] [PubMed] [Google Scholar]
- K. Linde, G.C. Fthenakis, A. Fichtner, Vet. Microbiol. 62, 121–134 (1998) [CrossRef] [PubMed] [Google Scholar]
- M.T.G. Holden, H. Hauser, M. Sanders, T.H. Ngo, I. Cherevach, A. Cronin, PLoS One 4, 60–72 (2009) [Google Scholar]
- H. Sorum, Vet. Res. 32, 227–241 (2001) [CrossRef] [EDP Sciences] [PubMed] [Google Scholar]
- C. Werckenthin, M. Cardoso, J-L. Martel, S. Schwarz, Vet. Res. 32, 341–362 (2001) [CrossRef] [EDP Sciences] [PubMed] [Google Scholar]
- M.T.G. Holden, H. Hauser, M. Sanders, T.H. Ngo, I. Cherevach, A. Cronin, PLoS One 4, 60–72 (2009) [Google Scholar]
- C. Kehrenberg, G. Schulze-Tanzil, J-L. Martel, E. Chalsus-Dancla, S. Schwarz, Vet. Res. 32, 323–339 (2001) [CrossRef] [EDP Sciences] [PubMed] [Google Scholar]
- M.L. Hunt, B. Adler, K.M. Townsend, Vet. Microbiol. 72, 3–25 (2000) [CrossRef] [PubMed] [Google Scholar]
- D.J. Dwyer, M.A. Kohanski, B. Hayete, J. J. Collins, Mol. Syst. Biol. 3, 91 (2007) [Google Scholar]
- G. Storz, J. A. Imlayt, Current Opinion in Microbiology 2, 188–194 (1999) [CrossRef] [PubMed] [Google Scholar]
- A.M. Egorov, M.M. Ulyashova, M.Yu. Rubtsova, Acta Naturae 10, 39 (2018) [Google Scholar]
- V.P. Fisenko, E.V. Arzamastsev, E.L. Babayan et al. (IIA Remedium CJSC, Moscow, 2000) [Google Scholar]
- P. Chomczynski, N. Sacchi, Anal. Biochem. 162, 156–159 (1987) [CrossRef] [PubMed] [Google Scholar]
- A. Untergasser, I. Cutcutache, T.Ye.J. Koressaar, B.C. Faircloth, M. Remm, S.G. Rozen, Nucleic Acids Res. 40, e115 (2012) [CrossRef] [PubMed] [Google Scholar]
- G.M. Boratyn, C. Camacho, P.S. Cooper, G. Coulouris et al., Nucleic Acids Res. 41, W29W33 (2013) [Google Scholar]
- K.J. Livak, T.D. Schmittgen, Methods 25, 402–408 (2001) [CrossRef] [PubMed] [Google Scholar]
- D.J. Dwyer, M.A. Kohanski, B. Hayete, J. J. Collins, Mol Syst Biol. 3, 91 (2007) [Google Scholar]
All Tables
All Figures
|
Fig. 1. The results of the polymerase chain reaction using primers for amplification of the gene fragments blaOXA-1 (1), blaSHV (2), blaCMY-1 (3), blaNDM1 (4), blaCMY-2 (5), blaTEM (6), blaPSE (7), mdtK (8). M is a DNA marker with a length of 50 bp + |
| In the text | |
|
Fig. 2. The results of the polymerase chain reaction using primers for amplification of fragments of the genes aadA1 (1), aadA2 (2), aadB (3), aphA1 (4), ampR (5), sat (6), strA (7), strB (8) . M is a DNA marker with a length of 50 bp +. |
| In the text | |
|
Fig. 3. The results of the polymerase chain reaction using primers for amplification of fragments of the rmtB (1), armA (2), aphA3 (3), blaCTX-M (4), blaPER-2 (5), tnpA (6), tnpR (7) gene fragments. M is a DNA marker with a length of 50 bp +. |
| In the text | |
|
Fig. 4. The results of the polymerase chain reaction using primers for amplification of fragments of the dha-1 (1), int (2), intC1 (3), intC1c (4), intC2 (5), intC2c (6) genes. M is a DNA marker with a length of 50 bp +. |
| In the text | |
|
Fig. 5. Relative expression level of peroxidase, catalase, and SOD genes in E. coli 866 during the formation of cefotaxime resistance. Data normalized according to the control group |
| In the text | |
|
Fig. 6. Relative level of expression of peroxidase, catalase, and SOD genes in E. coli 866 during the formation of apramycin resistance. Data normalized relative to the control group |
| In the text | |
|
Fig. 7. Relative expression level of genes involved in the realization of genetic information in the cell in E. coli 866 with the development of cefotaxime resistance |
| In the text | |
|
Fig. 8. Relative expression level of genes involved in the implementation of genetic information in the cell in E. coli 866 with the apromycin resistance development |
| In the text | |
|
Fig. 9. Relative expression levels of helicase II and IV, as well as DNA polymerases I and III in E. coli 866 during the formation of cefotaxime resistance |
| In the text | |
|
Fig. 10. Relative expression levels of helicase II and IV, as well as DNA polymerases I and III in E. coli 866 during the formation of apromycin resistance |
| In the text | |
Current usage metrics show cumulative count of Article Views (full-text article views including HTML views, PDF and ePub downloads, according to the available data) and Abstracts Views on Vision4Press platform.
Data correspond to usage on the plateform after 2015. The current usage metrics is available 48-96 hours after online publication and is updated daily on week days.
Initial download of the metrics may take a while.