| Issue |
BIO Web Conf.
Volume 17, 2020
International Scientific-Practical Conference “Agriculture and Food Security: Technology, Innovation, Markets, Human Resources” (FIES 2019)
|
|
|---|---|---|
| Article Number | 00159 | |
| Number of page(s) | 4 | |
| DOI | https://doi.org/10.1051/bioconf/20201700159 | |
| Published online | 28 February 2020 | |
Evaluation of variability of agrochemical properties on agricultural lands in precision farming perspective technologies
Institute of Environmental Sciences, Kazan Federal University, Kazan 420008, Russia
* Corresponding author: This email address is being protected from spambots. You need JavaScript enabled to view it.
Abstract
Using the example of two crop rotation fields located in the chernozem zone of the Republic of Tatarstan, the spatial variability of soils agrochemical properties was assessed in terms of the application of precision farming technologies when applying mineral fertilizers. It is shown that the use of mixed samples of polygons with an area of 5 ha as an elementary sampling site is sufficient detail for a geostatistical description of the spatial heterogeneity of the agrochemical properties of chernozem soils.
© The Authors, published by EDP Sciences, 2020
 This is an Open Access article distributed under the terms of the Creative Commons Attribution License 4.0, which permits unrestricted use, distribution, and reproduction in any medium, provided the original work is properly cited.
1 Introduction
Modern technologies of precision farming, which have been widely introduced recently in agricultural production, imply an assessment of the spatio-temporal heterogeneity of agricultural lands, and the strategy for their implementation is focused on adapting the crop system to the spatial heterogeneity of crop rotation fields. One of the main problems in the implementation of precision farming technologies in Russia is the absence of the required number of accurate maps of the availability of available nutrients for agricultural lands. The detection and mapping of changes in the content of available forms of nutrients in the soil is the main problem for the implementation of precision farming methods in real production [1]. Detailed mapping of nutrient content is difficult due to the fundamental property of soils — variability and heterogeneity of the soil cover. The variability of soil properties for a long time was considered as a hindrance during the agrochemical survey and while conducting monitoring of soil properties [2]. Traditionally, the study of variability was given an important place in the study of soil cover structures [3], its heterogeneity [4, 5], and the identification of statistical estimates and distribution of soil properties [6, 7].
The introduction of precision farming systems requires the use of special methods for conducting agrochemical surveys, which provide adequate models of the spatial heterogeneity of arable land for the availability of available nutrients. The results of the agrochemical survey are the basis for obtaining digital cartograms of the application of mineral fertilizers. The construction of maps for variable rate prescription is carried out on the basis of spatial interpolation of local sampling results on the entire investigated territory. They must provide the required accuracy of applying mineral fertilizers with special machines, which, in turn, makes it necessary to conduct an agrochemical survey with a greater degree of detail and precise reference to the terrain.
Modern geostatistical interpolation methods, hybrid methods, and machine learning methods allow describing with high accuracy the variability of agrochemical properties and provide a reliable estimate of the content of available NPK forms over the entire space of the examined field [8, 9]. On the basis of interpolated maps obtained using geostatistical methods, it is possible to make an accurate calculation of the fertilizer application doses at a specific site (application cell) using precision farming systems.
2 Materials and methods
The evaluation of spatial variability of soil properties was estimated on the territory of two fields located in the southeastern part of the Republic of Tatarstan (Russia), field № 1 (95 ha) in Zainsky district, field № 2 (313 ha) in Sarmanovsky district. The soil cover of the studied territories is represented by leached chernozems typical of this zone. The survey areas differ significantly in the relief and development of water erosion processes. To study the patterns of soils spatial heterogeneity, field № 1 was examined with more detail of sampling. The 60 mixed samples were sampled with an elementary area of 1.5–2 ha. To estimate the possibility of using the ordinary kriging (OK) method, the traditional interpolation method used to create maps of the supply of nutrients for precision farming; less detailed sampling was conducted in field № 2. From each an elementary site (5 ha) 62 samples were sampled. In both cases, elementary mixed sampling sites were created in a shape close to squares, which made it possible to obtain an adequate regionalization model when applying kriging methods. The sampling tracks were laid along the diagonal of elementary areas with the exact fixation of the coordinates of the points at the beginning and end of the route. While sampling, a TRIMBLE JUNO 5D GPS field controller was used with an accuracy of 1 m. The mixed samples were determined: the content of hydrolyzable nitrogen (Kornfield method), available forms of phosphorus and potassium (Chirikov method) and pHKCl [10]. The results of determining the indicators during the interpolation were georeferenced to the coordinates of the elementary areas centroids. Statistical data processing was performed using the statistical environment of the object-oriented language R. Variogram analysis and spatial interpolation by ordinary kriging were performed using the “gstat” package of the R language [11].
3 Results and discussion
Descriptive statistics show that the distribution of soil properties in the areas is heterogeneous. In the field № 1, the content of hydrolyzable nitrogen is characterized as increased, average variability (Table 1). The content of available forms of potassium and phosphorus varies from high values to very high. The variability of the values of available phosphorus is characterized as very strong, of available potassium – as average. In the field № 2, the content of hydrolyzable nitrogen is characterized as low, the variability is strong, the content of available phosphorus is characterized as increased, the available potassium is very high, and their variability is characterized as strong (Table 2).
In the studied fields, the content of available forms of nutrients and pH are described by isotropic semivariograms and approximated by spherical theoretical models. As an example of the presentation of the variogram analysis, we used the variograms of the content of available phosphorus (Fig. 1), since this property is characterized by the highest spatial variability.
Quantitative values of theoretical semivariograms are described in Table 3. The nugget / sill ratio for field № 1 indicates a strong spatial dependence of the available phosphorus content; for field № 2, this ratio indicates a moderate gradation dependence of the estimates proposed by Cambardella et al. [12]. The fields differ in the range, for field № 1 it is 656.8 m, which is 1.8 times smaller compared to field № 2, for which the range is 1225.65 m.
The difference in the range is associated with scale effects, since when using a cell with an area of 5 hectares as an elementary area, the length of the sides of the cell is 224*224 m. In field № 1, sampling was carried out in elementary area with an area of 2 hectares with side lengths of 122*122 m. The cell sizes ratio is also 1.8 units. Accordingly, the value of the range available phosphorus semivariogram content for field № 1 could not approach the value of the range for the available phosphorus of field № 2. At the same time, the nugget value for the semivariogram of field № 2 is higher (476.05) compared to field № 1 (301.29). Nevertheless, the variogram for field № 2 quite satisfactorily describes the spatial variability of the available phosphorus content. In the absence of spatial dependence at the distances of the sampling step, the effect of a “pure nugget” would be observed, or the effect of an “artificial nugget” would occur if spatial structures have a range smaller than the sampling step. The “artificial nugget” effect can occur when sampling by systematic grids with a fixed distance between the sampling points or when sampling mixed samples from elementary sites with reference of the results to centroids, the distance between which is determined by the size of the sampling sites.
The results of the analysis of variograms show that when developing a methodology for an agrochemical survey for introducing precision farming systems, the question of choosing the size of an elementary area becomes difficult. If the size of the elementary area is unreasonably small, this can lead to excessive detail of the survey and increase the cost of the survey. If the size of the elementary section is too large, there is a possibility that the distance between the centroids will be greater than the range and the effect of “artificial nugget” will be observed. In this case, the use of geostatistical interpolation methods (including OK) becomes impossible, and it is necessary to use deterministic interpolators, which are characterized by a deliberately low reliability of spatial prediction in comparison with the OK method.
From the results of the survey and variogram analysis, we can conclude that the use of elementary areas for agrochemical soil survey in the chernozem’s zone of 1-1.5 ha is clearly excessive, since this increases the number of samples, the cost of realization the project on the introduction of precision farming technologies increases. For the soil distribution zones of the chernozem series, it is possible to limit ourselves to elementary areas of 5 ha in size.
Checking the efficiency of spatial interpolation of soil properties was carried out on the basis of plots on which the predicted values are plotted against the observed values. Figure 2 shows these plots for the available forms of potassium and phosphorus in the study areas.
For available potassium (field № 1), the value of the adjusted determination coefficient is R2 = 0.16; for field № 2, the predicted potassium values describe 56% of the actual values. For phosphorus (field № 1), the correspondence of the predicted values to the observed values was not high (R2 = 0.37), in contrast to field № 2, where the predicted phosphorus content described 79% of the observed values.
The low correlation between the predicted and observed values for field № 1 is most likely due to local changes in the phosphorus and potassium content caused by variability in environmental conditions and agricultural practice. From the results of data comparison, a more detailed survey of field № 1 did not provide an increase in the reliability of the spatial predict, which also indicates the unjustified sampling from elementary areas of 1.5–2 ha.
The planning and conducting soil sampling methods during agrochemical field surveys for the introduction of precision farming technologies in the chernozem zone of the Republic of Tatarstan proposed by the authors were tested in practice. Since 2017, more than 25 thousand hectares of arable land located in Zakamye region of the Republic of Tatarstan have been surveyed.
On the majority of the surveyed fields (more than 80%), the OK method was used to construct interpolated maps of the supply of nutrients. The number of samples taken with elementary sizes of 5 ha was more than 50. When using the restricted maximum likelihood method to calculate the parameters of the base models, 50 point-localized data is considered the minimum acceptable [13].
The OK method was also used for smaller fields that were combined into a single interpolation cluster if they were close to each other and were confined to one relief element. In all cases, when using the OK method for interpolation, the spatial patterns of changes in the content of available nutrients and pH were described by transitive semivariograms with a reliably set sill and range.
In small fields, to construct interpolated maps, it was necessary to use a deterministic interpolator - the method of Inverse Distance Weighting (IDW). The IDW method is characterized by low reliability of spatial prediction (due to the “bull’s-eye effect”), but has no restrictions on the number of points used for interpolation.
Main statistical indicators of soils (field № 1).
Main statistical indicators of soils (field № 2).
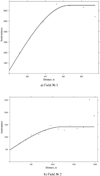 |
Fig. 1. Available phosphorus variograms for two fields |
Quantitative values of theoretical variograms of the content of mobile phosphorus.
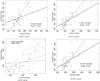 |
Fig. 2. OK predicted values versus observed values. The solid line is the regression line, the shaded line is the 1: 1 line. |
4 Conclusion
From the work done, we can conclude that an elementary area of 5 ha in size for sampling mixed samples with the aim of introduction precision farming systems in the chernozem zone of the Republic of Tatarstan allows a fairly high accuracy to describe the spatial variability of the agrochemical properties of soils. In the case of low efficiency of the OK interpolation method, a wider range of interpolators should be used or factors affecting the variability of soil properties should be taken into account when developing methods for the agrochemical survey of arable land for the application of precision farming systems.
Acknowledgments
This work was supported in part by the Russian Foundation for Basic Research, research project No. 1929–05061 mk.
References
- K.R. Krishna, Precision farming. Soil Fertility and Productivity Aspects (Apple Academic Press, Toronto, 2013) [Google Scholar]
- V.P. Samsonova, Spatial variability of soil properties: the example of sod-podzolic soils (LKI, Moscow, 2008) [Google Scholar]
- V.M. Fridland, Soil structure (Mysl, Moscow, 1972) [Google Scholar]
- E.A. Dmitriyev, Theoretical and methodological issues of soil science (Geos, Moscow, 2001) [Google Scholar]
- L.O. Karpachevskiy, Large-scale effects in soil research (MSU, Moscow, 2001) [Google Scholar]
- N.S. Oreshkina, Statistical estimates of spatial variability of soil properties (MSU, Moscow, 1988) [Google Scholar]
- A.S. Frid, Spatial variation and temporal dynamics of soil fertility in long field experiments (Rosselkhozakademiya, Moscow, 2002) [Google Scholar]
- I.A. Sahabiev, K.G. Giniyatullin, S.S. Ryazanov, IOP C Ser. Earth Env., 107, 1–8 (2018) [Google Scholar]
- I.A. Sahabiev, S.S. Ryazanov, T.G. Kolcova, Eurasian Soil Sci., 51, 255–267 (2018) [CrossRef] [Google Scholar]
- Guidelines for integrated monitoring of soil fertility of agricultural lands (FGNU “Rosinformagrotekh”, Moscow, 2003) [Google Scholar]
- E.J. Pebesma, Multivariable geostatistics in S: the gstat package (Computers & Geosciences, Utrecht, 2004) [Google Scholar]
- C. Cambardella, T. Moorman, J. Novak, T. Parkin, D. Karlen, R. Turco, A. Konopka, Soil Sci. Soc. Am. J., 58, 1501–1511 (1994) [Google Scholar]
- R. Kerry, V.A. Oliver, Z.L. Frogbrook, Geostatistical Applications for Precision Agriculture (Springer Science+Business Media B.V., 2010) [Google Scholar]
All Tables
Quantitative values of theoretical variograms of the content of mobile phosphorus.
All Figures
|
Fig. 1. Available phosphorus variograms for two fields |
| In the text | |
|
Fig. 2. OK predicted values versus observed values. The solid line is the regression line, the shaded line is the 1: 1 line. |
| In the text | |
Current usage metrics show cumulative count of Article Views (full-text article views including HTML views, PDF and ePub downloads, according to the available data) and Abstracts Views on Vision4Press platform.
Data correspond to usage on the plateform after 2015. The current usage metrics is available 48-96 hours after online publication and is updated daily on week days.
Initial download of the metrics may take a while.