| Issue |
BIO Web Conf.
Volume 20, 2020
1st International Conference on Tropical Wetland Biodiversity and Conservation (ICWEB 2019)
|
|
|---|---|---|
| Article Number | 02002 | |
| Number of page(s) | 6 | |
| Section | Wetland Ecosystems and Sustainable Tourism | |
| DOI | https://doi.org/10.1051/bioconf/20202002002 | |
| Published online | 01 June 2020 | |
The Influence of Tidal on Fe Distribution at Tidal Swamp Rice-Farming in Barito River Area, South Kalimantan, Indonesia
1 Indonesian Swampland Agriculture Research Institute, Jln Kebun Karet PO box 31 Banjarbaru. South Kalimantan, 70712, Indonesia
2 Department of Soil Science, Faculty of Agriculture, Gadjah Mada University,
3 Department of Agriculture Engineering and Biosystem, Faculty of Agricultural Technology, Gadjah Mada University Flora Street no 1 Bulaksumur, Yogyakarta, 55581, Indonesia
4 Department of Geographic Information Sciences, Faculty of Geography, Gadjah Mada University, Geografi Street no 1 Bulaksumur, Yogyakarta, 55581, Indonesia
* Corresponding author: This email address is being protected from spambots. You need JavaScript enabled to view it.
Abstract
Iron (Fe) poisoning can cause problems on growth, the formation of saplings, and the filling of grains. These problems lead to and plant death or decrease in productivity. The inhibition of growth and production is increasingly higher in susceptible varieties. The distribution of iron concentration varies in different regions and locations of swamp rice farming. Various adverse effects of iron poisoning on rice have been widely reported, but the spatial distribution of iron in tidal fields is still rare. Iron distribution in various soil profile depths has not been widely investigated and data availability to avoid Fe poisoning in tidal swamps has not been widely reported. Spatial distribution of Fe concentrations is needed as a reference for rice cultivation in tidal swamps. This study has been conducted in November 2015 until August 2017 using the survey method in the Barito River area, South Kalimantan, Indonesia. The use of thematic maps such as tidal height difference (Δ), tidal flood type, and thickness of mud map. The results showed that the spatial concentration of Fe is highest in the zone I which has the highest difference (Δ) of high tide maximum and low tide maximum. While on the soil profile, the highest of Fe concentration is in layer 1 and the lowest concentration is in layer 3. Based on the overflow type, the highest Fe concentration is typed A and type B especially close to the estuary. To prevent iron poisoning, rice seedlings should reach layer 2 (> 10 cm) and choose the safe zone that is zone II, III, or IV to produce optimal rice production.
© The Authors, published by EDP Sciences, 2020
 This is an Open Access article distributed under the terms of the Creative Commons Attribution License 4.0, which permits unrestricted use, distribution, and reproduction in any medium, provided the original work is properly cited.
1 Introduction
The yield of rice in tidal swamps is relatively low less than 2.5 tons per hectare with annual cropping intensity. It is primarily due to physicochemical factors, such as iron poisoning. The pyrite layer (FeS2) from a depth of 30-60 cm exposed to soil surface that oxidized and causing this problem. In the dry season, the pyrite layer was oxidized [1]. In general, iron poisoning can reduce rice yields until 50%, especially in susceptible varieties [2, 3, 4]. The high solubility of iron is usually followed by the high solubility of aluminum (Al) and manganese (Mn) to toxic levels for rice [5]. In the Dadahup district of Kuala Kapuas, Central Kalimantan, the iron (Fe) distributed with the total concentration of Fe are 122-255 mg kg-1 in Typic Sulfaquent and 54-89 mg kg-1 in Histic Sulfaquent [6].
The study of Fe distribution was also conducted in Nigeria but was limited to discuss the only Fe2+ at the different geomorphological zones in the Niger Delta region of Nigeria. This study characterized the distribution and occurrence of Fe2+ in the groundwater sources from the five (5) geomorphologic units that made up the Niger Delta [7]. Similar research was conducted by Somaratne in Australia that provided insight to control the occurrence of iron in groundwater which, is essential for public water supply source. The study added stable isotopes to the freshwater lens, to show the degree of evaporative enrichment and possible local recharge areas. Major ion chemistry of groundwater was analyzed to show groundwater mixing along flow paths. The value of redox potential, dissolved oxygen, and dissolved organic carbon content was evaluated to describe Fe (III)/Fe (II) transformation in the groundwater and relate this to iron distribution within the freshwater lens [8].
Various adverse effects of iron poisoning on rice have been widely reported including the distribution of Fe, but the spatial distribution of iron in tidal fields is still rare. Iron distribution in various depths in soil profiles in tidal areas has also not been studied that efforts to avoid Fe toxicity in tidal swamps have not been widely reported. Thus, it is necessary to research to know the concentration of Fe and its spatial distribution and distribution on the soil layer as the direction for rice cultivation in the tidal swamp.
2 Material and Methods
2.1 Sampling sites
The study was conducted from November 2015 to August 2017 in the Barito River area of 650 km2, South Kalimantan, at the ordinates of 114°45’932’’- 114°26’682’’ E and 025°92’52’’ - 032°53’21’’ S. The location was extending from the sea estuary up to 60 km upstream and extending inward about 10 km along the primary channel. A detailed sampling site where the soil sampled could be seen in Fig. 1.
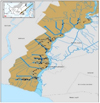 |
Figure 1 Sampling site where the soil was sampled along the Barito river area, South Kalimantan. Marked representing a total of 44 sampling points. |
2.2 The procedures of the study
This study was conducted by a direct survey of two types of tidal swamp areas, following Widjaja-Adhi [9] criteria. First, based on the difference between high and low tide (Δ). This form has differentiated into four zones, namely zone I (> 120 cm), zone II (120-100 cm), zone III (100-80 cm), and zone IV (<80 cm). To determine each of these zones, we take measurement directly on tidal water in each primary channel for 24 hours. Second, following the type of tidal flood. This type consists of four forms as well, namely, type A, B, C, and D. Type A characterized by submerged water during high and low tides. Type B indicated by submerged water during the high tide only. Type C marked by non-submerged water at high and low tides and its water table depth <50 cm. Type D is shown by non-submerge water at high and low tides and its water table depth > 50 cm.
The information above was arranged as a reference to determine the location of observation. Survey and analysis were conducted by taking soil samples in each land unit with a total sampling of 44 points (Figure 1) that distributed along the primary channel as representative of each zone. In each sampling point, the soil was sampled at 3 different levels, namely layer 1 (0 -10 cm), layer 2 (10-20 cm), and layer 3 (20 - 30 cm).
The total concentrations of Fe were analyzed in the laboratory and then classified as low (0-100 mg kg-1) relatively safe for plants, moderate (100-300 mg kg-1) which can lead to bronzing in early-stage, high (300-500 mg kg-1) which can poisoning the rice, and very high (> 500 mg kg-1) [10, 11]. The concentration of Fe-available soil was set up using the extract of Ammonium Acetate at pH 4.8.
The data was then displayed using a bar chart to see the Fe concentrations at a different layer, as well as the distribution of Fe that corresponds to the different height of maximum high tide and maximum low tide, plotted as the tidal map. Similarly, it has also done for the tidal flood type A, B, C, and D.
3 Results and Discussion
3.1 Fe Distribution among Soil Layer
The Fe concentration at the layer 0-10 cm, 10-20 cm and 20-30 cm of 44 sampling points from the estuary up to 60 km upstream are shown in Figure 2 and Figure 3: To facilitate presentation and discussion the data are divided into two groups: 0 - 30 km and 30 - 60 km from the sea estuary.
Based on Figures 2 and 3, the Fe concentration at layer 1 is generally higher than both layers 2 and 3. In the upstream area of layer 1, the average of Fe concentration is 199.7 mg kg-1, whereas in layers 2 and 3 are 114.1 and 103.4 mg kg-1, respectively. The same pattern also is shown in the downstream area, where the Fe concentration of layer 1 (449.1 mg kg-1) is higher than layers 2 and 3, with 391.9 and layer 3 is 387.7 mg kg-1, respectively. This pattern indicates the accumulation of Fe in downstream comes from upstream due to the water brought back at high tide and settles at low tide at the lower reaches of the Barito River area. This also causes why the Fe concentration in samples 48A, 52B, 55A, 57A, and 59A at the downstream area is very high.
In this study, the Fe concentration is in the range of <330 mg kg-1 for layer 1 (40.4 - 1221.1 mg kg-1). Whereas in layer 2 is about 34.8 - 1100 mg kg-1 which is mostly <250 mg kg-1 and the last layer is mostly <150 mg kg-1.
The decrease in Fe concentration as the increases in depth is related to the chelate of Fe by organic matter through the process of humification. Organic acids suppress Fe3+ activity with the formation of organo-metal compounds [12]. Similarly, Revsbech [13] points out that the highest Fe 2+ concentrations are at a depth of 2-15 cm, then decrease in the lower layers containing less organic matter [13].
The distribution of Fe concentration on soil profile tends to decrease with depth. It suggested that rice planting in tidal land is safe by using large seeds size so that the stems and roots can reach a deeper layer of more than 10 cm. Large seedlings are generally 2 months old such as local varieties that can be planted in layer 2.
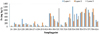 |
Figure 2 The Fe-available concentration of 3 soil layers located downstream of Barito River, South Kalimantan, Indonesia (0-30 km from sea estuary). |
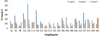 |
Figure 3 The Fe-available concentration at 3 layers located upstream of Barito River, South Kalimantan, Indonesia (30-60 km from sea estuary). |
3.2 The effect of the highest difference of tide (Δ)
One factor affecting the Fe distribution in tidal swamplands is water that carrying mud mixed with Fe particles and other elements that eventually settle to form alluvial soils. Horizontally the tide moves from the estuary to upstream are described in Figures 4, 5, and 6. The difference between both the maximum high and low tide is getting smaller toward upstream. It affects the distribution of Fe concentrations at each site. The results showed that Fe concentrations were higher at > 120 cm (zone I), whereas in Δ 100-120 cm (zone II) and Δ80 -100 cm (zone III) Fe, and Δ < 80 cm (zone IV) Fe concentrations were moderate to low, respectively.
In layer 1, the Fe distribution with the highest concentration is mostly located in a zone I (Δ >120 cm). It is strongly suspected due to pyrite (FeS2) which oxidized to produces Fe3+, SO4- and H+ during the dry season (Dent, 1986). In the upstream zone (zone IV), carrying water at high tide then deposited in the downstream area (zone I) at low tide, which causes the Fe concentration to becomes high. The difference between both maximum high and low tides causes fast-moving water currents to carry sediment containing Fe. This lead to an increase in total suspended deposits [14].
In layers 2 and 3, Fe concentrations generally decreased, except for some sampling points, such as points 48A and 55A, show the high and very high concentration. It is allegedly due to the various sedimentation processes each year. Deposited of mud on the rice field is always there is the addition of mud on the layers whose quality and quantity varies greatly. It is due to drainage, which has changed the water surface layer. Thus, it is possible to reconstruct the origin and transformation of the soil in the alluvial-swamp [15].
In zone II of layer 1, the Fe concentrations ranged from medium (200-300 mg kg1) to low (0-100 mg kg1), while in layers 2 and 3 were generally low. Especially in layer 3 with concentrations <100 mg kg1 to 22.2 mg kg-1. There was less soil sampling in zones III and IV due to the field conditions, and based on the map is relatively less varied. The concentration of Fe ranges from low to medium, 278.7 mg kg-1 to 77.6 mg kg-1 in those zones.
Based on the spatial distribution of Fe concentration, the safest zone for rice planting is in zones II and III because the Fe concentration is low on all layers. In zone I with a very high concentration of Fe (especially in layer 1), rice cultivation should use resistant varieties to Fe toxicity like Inpara 1 (Indonesian superior) or local varieties.
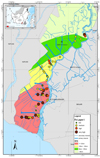 |
Figure 4 Distribution of Fe-available due to the influence of high difference (Δ) ups and downs in layer 1(0-10 cm) in the rice-farming area of Barito River. |
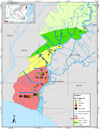 |
Figure 5 The distribution of Fe-available due to the influence of high difference (Δ) ups and downs in layer 2(10-20 cm) in the rice-farming area of Barito River, South Kalimantan, Indonesia. |
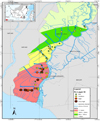 |
Figure 6 The distribution of Fe-available in layer 3 due to the influence of high difference (Δ) ups and downs in layer 3 (20-30 cm) in the rice-farming area of Barito River, South Kalimantan, Indonesia. |
3.3 The effect of different flood types on Fe distribution
Based on the hydro-topography of the tidal land distinguished by the flood types A, B, C, and D (Figures 7, 8, and 9). The highest Fe concentrations are present in type A and part of type B. In type A, tidal flooded the area in high and low tides, whereas, in type B, the area flooded at high tide only [9]. Fluctuations in water flow into the rice field land caused the height of Fe concentration from water to settle in the area.
Following Figures 7, 8, and 9 are also shown anomalies in several places such as in sample points 53 A and 53 B with concentrations of Fe in layer 3 higher than layer 2. In layer 1 at sample point 53 A, the concentration of Fe is 792 mg kg-1, then decrease in layer 2 of 440.7 mg kg-1, but the increase in layer 3 reached 646.4 mg kg-1. While at point 53 B, in layer 1 the concentration of Fe 1221 mg kg-1, then decrease in layer 2 to 353.1 mg kg-1, then rose again to 437.9 mg kg-1.
The difference in pattern is suspected due to the highest tide factor and the lowest tide with the strong current. Increased water flow rates and water discharge may cause Fe to remain suspended [16]. Thus affecting the total suspension of sediments and ultimately affecting the sedimentation process at a particular location and time, thereby causing the distribution of iron to be transported at different locations and layers of different patterns [17].
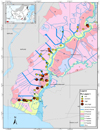 |
Figure 7 Distribution of Fe concentrations in layer 1 in various types of tidal swamp floods in the Barito River region. |
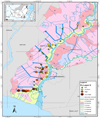 |
Figure 8 Distribution of Fe concentrations at layer 2 in various types of tidal swamp floods in the Barito River region. |
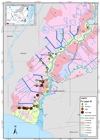 |
Figure 9 Distribution of Fe concentrations in layer 3 in various types of tidal swamp floods in the Barito River region. |
4 Conclusion
The highest of Fe concentration is in layer 1 of 400-1200 mg kg-1, then decreases with increasing in depth until it reached layer 3 with Fe concentration is generally low (<100 mg kg-1). The maximum height difference between maximum high tide and maximum low tide is directly proportional to the high concentration of with the highest concentration of Fe occurred in zone I. Based on the effect of land hydro-topography, the highest Fe concentration is mainly located in the downstream areas of both type A and type B, near the estuary sea. Prevention of iron poisoning in rice may use a large size of the seeds therefor root range can reach layer 2 (10-20 cm), III, or IV. In the zone, I, the planting of seedlings should be done more than 10 cm in depth or using varieties resistant to iron poisoning.
The author would like to thank the Agency for Agricultural Research and Development. Ministry Agriculture of the Indonesia Republic who helped finance this research.
References
- J. Shamsuddin, S. Muhrizal, I, sFauziah and E Van Ranst. A.laboratory study of pyrite oxidation in acid sulfate solils. Communication in Soil Science and Plant Analysis, (2004) [Google Scholar]
- Audebert. Diagnosis of risk and approaches to iron toxicity management in lowland rice farming. In: Audebert, L.T. Narteh, P. Klepe, D. Millar, and B. Beks(eds.). Iron Toxicity in rice-based System in west Africa. Africa Rice Center WARD A, Cotonou, Benin. 175 p, (2006) [Google Scholar]
- T. Nozoe, R. Agbisit, Y. Fukuta, R. Rodriguez, and S. Yanagiraha. The iron (Fe)-excluding power of rice rootas a mechanism of tolerance of elite breeding lines to iron toxicity. New Directions for A Diverse Planet : proc. of The int. Crop Sci Congress. Brisbane, Autralia, 26 Sept - Oct, (2004). [Google Scholar]
- T. Nozoe, R. Agbisit, Y. Fukuta, R. Rodriguez, and S. Yanagiraha. Charakteristics of iron tolerant rice lines developed at IRRI under field condition. JARQ 42 (3): 187-192, (2008) [CrossRef] [Google Scholar]
- D. Dent. Acid Sulphate Soils. a Baseline for research and development Publication. ILRI Wageningen, Publ. No.39 The Netherlands. 204 p. (1986) [Google Scholar]
- Anda, M. Siswsanto, A.B., & Subandiono, R.E. Properties of Organic and Acid Sulfate Soils and Water of a Reclaimed Tidal Backswamp in Central Kalimantan, Indonesia, Jurnal Geoderma, 149: 54-65, (2009) [CrossRef] [Google Scholar]
- P. Harcourt. Iron (Fe2+) occurrence and distribution in groundwater sources in different geomorphologic zones of Eastern Niger Delta, (January). Scholars Research Library, (2016) [Google Scholar]
- S. Australian, Corporation, W., Input, G., Model, I.C., Framework, H., & Basin, U.S. Characterization of the Effects of Redox Condition on Fe ( III )/ Fe ( II ) Transformation in a Small Karstic Aquifer: Poocher. Characterization of the Effects of Redox Condition on Fe ( III )/ Fe ( II ) Transformation in a Small Karstic Aquifer: Po, (October). https://doi.org/10.5539/enrr.v6n3p134, (2016) [Google Scholar]
- I.P.G. Widjaja-Adhi. Pengelolaan lahan rawa pasang surut dan lebak. J. Litbang Pertanian. Badan Litbang Pertanian Jakarta, (1986) [Google Scholar]
- Dobermann & Fairhust. Rice. Nutrient disorders & nutrient management. Handbook series. Potash & Phoshate Institute (PPI). Potash & Phosphate Institute of Canada (PPIC) and International Rice Research Institute, (2000) [Google Scholar]
- K.L. Sahrawat. Elemental Composition of the rice plant as affected by iron toxicity under field condition. Commun. Soil Sci. Plant Anal. 31 (17/18): 2819-2827, (2000) [Google Scholar]
- ID. Pulford, CA. Backes, and H.J. Duncan. Inhibition of pyrite oxidation in coal mine waste. P.59 - 67. In: Dost (ed). Selected Papers of the Dakar Symp. Acid Sulphate Soil. ILRI Publ 44, (1986) [Google Scholar]
- N.P. Revsbech, B.B. Jorgensen, and T.H. Balckburn. oxygen in the sea bottom measured with a microelectrode. Science 207 : 1355 - 1356, (1980) [Google Scholar]
- M. Hairul, A. Kamarudin, M.E. Toriman, N.A. Wahab, H. Rosli, M. Ata, M. Faudzi. Sedimentation Study on Upstream Reach of Selected Rivers in Pahang River Basin, Malaysia, IJASEIT. 7 (1), 35-41, (2017) [Google Scholar]
- Beata, Ł., & Kabala, C. Catena Human-induced development of mollic and umbric horizons in drained and farmed swampy alluvial soils, 139, 117-126, (2016) [Google Scholar]
- Wahab, N.A., Khairul, M., Kamarudin, A., Gasim, M.B., Umar, R., Ata, F.M., & Sulaiman, N.H. Assessment of Total Suspended Sediment and Bed Sediment Grains in Upstream Areas of Lata Berangin, Terengganu, IJASEIT. 6(5), 757-763, (2016) [Google Scholar]
- Hariyanto, T., Krisna, T.C., & Pribadi, C.B. (2017). Development Total Suspended Sediment Model Using Landsat-8 OLI and In-Situ Data at Surabaya Coast, East Java, Indonesia. Indonsian Journal of Geography. 49(1): 73-79, (2017) [CrossRef] [Google Scholar]
All Figures
|
Figure 1 Sampling site where the soil was sampled along the Barito river area, South Kalimantan. Marked representing a total of 44 sampling points. |
| In the text | |
|
Figure 2 The Fe-available concentration of 3 soil layers located downstream of Barito River, South Kalimantan, Indonesia (0-30 km from sea estuary). |
| In the text | |
|
Figure 3 The Fe-available concentration at 3 layers located upstream of Barito River, South Kalimantan, Indonesia (30-60 km from sea estuary). |
| In the text | |
|
Figure 4 Distribution of Fe-available due to the influence of high difference (Δ) ups and downs in layer 1(0-10 cm) in the rice-farming area of Barito River. |
| In the text | |
|
Figure 5 The distribution of Fe-available due to the influence of high difference (Δ) ups and downs in layer 2(10-20 cm) in the rice-farming area of Barito River, South Kalimantan, Indonesia. |
| In the text | |
|
Figure 6 The distribution of Fe-available in layer 3 due to the influence of high difference (Δ) ups and downs in layer 3 (20-30 cm) in the rice-farming area of Barito River, South Kalimantan, Indonesia. |
| In the text | |
|
Figure 7 Distribution of Fe concentrations in layer 1 in various types of tidal swamp floods in the Barito River region. |
| In the text | |
|
Figure 8 Distribution of Fe concentrations at layer 2 in various types of tidal swamp floods in the Barito River region. |
| In the text | |
|
Figure 9 Distribution of Fe concentrations in layer 3 in various types of tidal swamp floods in the Barito River region. |
| In the text | |
Current usage metrics show cumulative count of Article Views (full-text article views including HTML views, PDF and ePub downloads, according to the available data) and Abstracts Views on Vision4Press platform.
Data correspond to usage on the plateform after 2015. The current usage metrics is available 48-96 hours after online publication and is updated daily on week days.
Initial download of the metrics may take a while.