Fig. 2
Download original image
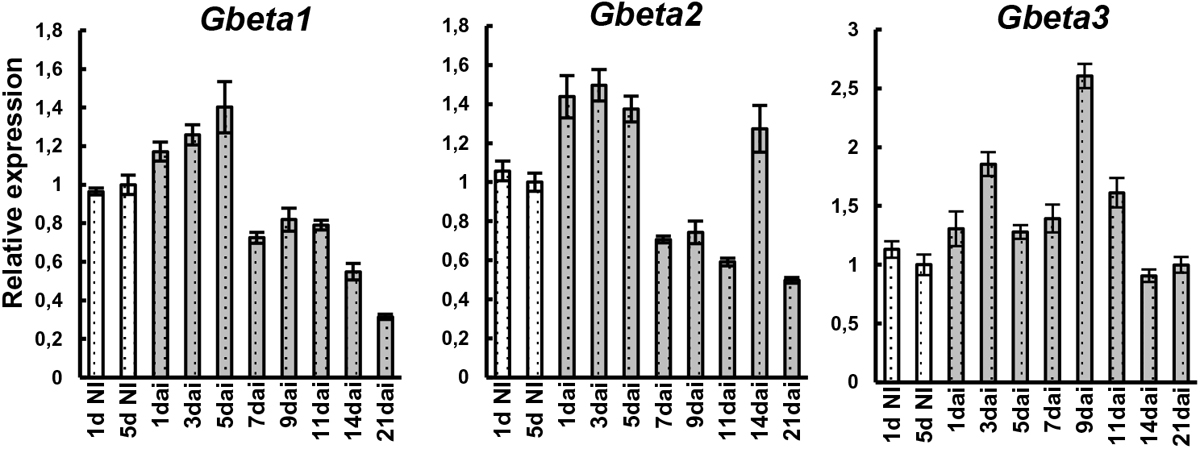
Expression dynamics of the Gbeta1, Gbeta2 и Gbeta3 genes encoding the beta , 2 и 3-subunits of the G protein in pea roots and nodules at 1, 3, 5, 7, 9, 11, 13, 15, and 21 days after inoculation in relation to uninoculated variants (1d NI and 5d NI). Bars represent SEM. Two biological replicates were analyzed and the results of a representative repeat were shown in the graphs.
Current usage metrics show cumulative count of Article Views (full-text article views including HTML views, PDF and ePub downloads, according to the available data) and Abstracts Views on Vision4Press platform.
Data correspond to usage on the plateform after 2015. The current usage metrics is available 48-96 hours after online publication and is updated daily on week days.
Initial download of the metrics may take a while.