| Issue |
BIO Web Conf.
Volume 28, 2020
The 3rd International Conference on Bioinformatics, Biotechnology, and Biomedical Engineering (BioMIC 2020)
|
|
|---|---|---|
| Article Number | 01002 | |
| Number of page(s) | 4 | |
| Section | Bioinformatics and Biological Data Mining | |
| DOI | https://doi.org/10.1051/bioconf/20202801002 | |
| Published online | 17 December 2020 | |
Detection of 16S mitochondrial sequence polymorphism and haplotype network of Ophiocara porocephala (Valenciennes, 1837) from Tekolok Estuary (NTB, Indonesia) using DnaSP and NETWORK
Laboratory of Genetics and Breeding, Faculty of Biology, Universitas Gadjah Mada, Jl. Teknika Selatan, Sekip Utara, Yogyakarta 55281, Indonesia
* Corresponding author: tuty-arisuryanti@ugm.ac.id
The two genetic software, DnaSP and NETWORK, is commonly used to analyse gene polymorphism and haplotype network which is useful for the understanding pattern of genetic variation and genetic relationship. In this study, the two software were applied to detect polymorphism of 16S sequence gene of Ophiocara paracephala from Tekolok Estuary (NTB, Indonesia) which has not been investigated. This study used a PCR method with 16Sar and 16Sbr primers. The results revealed two haplotypes and two variable sites with one parsimony informative within O.paracephala from Tekolok Estuary population. Next, if the 16S sequence data of O.paracephala from Tekolok Estuary was combined with the 16S gene data of O.paracephala from GenBank, three haplotypes were detected with five variables sites and one parsimony informative. This finding showed intra-population and intraspecific genetic variation of O.paracephala. In addition, haplotype network using NETWORK and a phylogenetic tree using Neighbor Joining and Maximum Likelihood methods exhibited that O.paracephala from Tekolok Estuary has a close genetic relationship with O.paracephala from Japan.
Key words: 16S gene / O.paracephala / polymorphism / haplotype network
© The Authors, published by EDP Sciences, 2020
 This is an Open Access article distributed under the terms of the Creative Commons Attribution License 4.0, which permits unrestricted use, distribution, and reproduction in any medium, provided the original work is properly cited.
1 Introduction
The use of genetic software to analyse DNA polymorphism is now considered essential [1, 2]. DNA polymorphism can be detected from a single base pair change or many base pair changes and repeated sequences. DNA Sequence Polymorphism (DnaSP), a genetic software package, is commonly used to analyse DNA polymorphism of a single locus or several loci [3]. This software can measure DNA sequence variation at the intra-population level or intraspecific level in noncoding, synonymous or nonsynonymous sites, or in various sorts of codon positions. Another software, NETWORK (https://www.fluxus-engineering.com), is usually used to examine haplotype network among samples within and between populations. Both software are currently used to detect DNA polymorphism and haplotype network in freshwater fish species such as Urechis unicinctus [4], Steindachneridion scriptum [5], and Percocypris pingi [6].
This study used direct 16S mtDNA sequencing to determine intra-population and intraspecific genetic variation of O.paracephala and their haplotype network. The 16 mtDNA is a conserved gene which means the change of few nucleotides within or among the population can be used to indicate intra-population or intraspecific genetic variation [7]. No information related to genetic information of O.paracephala from Tekolok Estuary located at East Lombok (West Nusa Tenggara, Indonesia). Therefore, the objective of this study was to detect 16S mtDNA polymorphism within the population of O.paracephala from Tekolok Estuary and also examine intraspecific genetic variation and haplotype network of O.paracephala combined with O.paracephala from GenBank database.
2 Materials and methods
2.1 Sampling collection for 16S mitochondrial sequencing
Seven samples of Ophicara porochepala (code LTK01-LTK07) were collected from Tekolok Estuary (East Lombok, West Nusa Tenggara, Indonesia). The sampling location can be seen in Figure 1 (8o20’30.0”S 116o42’31.0”E). The fish samples were placed on ice in the field for short term preservation before photographing. The representative of fish sample was then documented (Figure 2). Next, small pieces of muscle tissue of each sample (50 mg) was put into 1.5 mL tube and preserved with 99 % ethanol for long time preservation and kept in -20 °C until further investigation
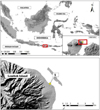 |
Fig. 1 Sample collection sites (1) of Ophiocara porocephala at Tekolok Estuary, West Nusa Tenggara |
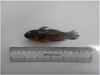 |
Fig. 2 Ophiocara porocephala collected from Tekolok Estuary (Documented by Lukman Hakim) |
2.2 DNA extraction, amplification, and sequencing of 16S mitochondrial gene: procedure and analysis
Total genomic DNA was extracted from muscle tissue using DNeasy tissue kit (QIAGEN, Valencia, USA) following the manufacturer’s standard protocol. The mtDNA 16S rRNA gene was amplified using forward 16Sar (5’-CGCCTGTTTA TCAAAAACAT-3’) and reverse 16Sbr (5’-CGGTCTGAACTCAGATCACGT-3’) primers [8]. The PCR was performed in a total volume of 50 μl, containing approximately 10-100 ng of genomic DNA, 25 μl MyTaq HS Red Mix PCR Kit (Bioline), 2 mM MgCl2, 0.6 μM of each primer, and 11 μl ddH2O. The PCR cycling was carried out in a thermocycler (Biorad) following cycle procedures conducted by Arisuryanti et al. [9]. Next, 1 % agarose gel was used to check the PCR products through electrophoresis and they were visualized under UV light after staining with GelRed (Bioline). The PCR products were then purified and sequenced in both direction at a commercial laboratory (First Base, Malaysia) in an ABI 3730xl DNA sequencer (Applied Biosystem)
SeqMan and EditSeq program (Lasergene, DNASTAR) were used to check and edit manually by eyes to detect ambiguous bases. The program Opal in MESQUITE v.3.51 [10] and ClustalW in MEGAX [11] was used for multiple sequence alignments. The nucleotide compositions (A, T, G and C) for each of the 16S mitochondrial gene fragments were calculated. Numbers of haplotypes, numbers of nucleotide polymorphic sites, haplotype diversity (h), and nucleotide diversity (π) were analysed with DnaSP ver 6.0 [3]. Haplotype diversity (h) is the average number of differences between random pairs of homologous haplotype sequences in a sample and nucleotide diversity (π) is the average number of differences between random pairs of homologous nucleotide sites in a sample [12]. Next, haplotype joining network was constructed using Median Joining Network in NETWORK v 10.1 (https://www.fluxus-engineering.com https://www.fluxus-). Kimura-2-parameter model using MEGAX [11] was used to estimate intraspecific genetic distance and was summarised in Neighbor-Joining (NJ) and Maximum Likelihood (ML) trees. The NJ and ML trees with bootstrap values (1,000 replication) were constructed using MEGAX [11]. The 1,000 repeated sampling tests were performed to obtain the support values of the clade nodes. In this study, two 16S sequence data of O.paracephala from Genbank with accession number AB079256 and KF415426 were included in analyses for a comparison purpose and two 16S sequence data of Oxyeleotris lineolate (KP684140) and Bostrychus sinensis (JQ665462) were used for the outgroup.
3 Results and discussion
The partial sequences of the mtDNA 16S genes of the seven O.porocephala (with code LTK-01, LTK-02, LTK-03, LTK-04, LTK-05, LTK-06, and LTK-07) examined in this study can be amplified (Figure 3). All of the sequences were 599 bp long, and neither insertions nor deletions were found.
The average rate of 16S nucleotide composition of the O. paracephala from Tekolok River can be seen in Table 1. The difference in the nucleotide between O.paracephala from Tekolok River and O.paracephala from Japan and UK recorded at GenBank was C=0-0.13 %; G=0.05-0.18 %; and A=0.19-0.24 %. The O.paracephala from Tekolok River had the highest frequency of nucleotide A compared to O.paracephala from Japan and UK. Based on Table 1, it can be seen that the composition of nucleotide T of O.paracephala from Tekolok Estuary, Japan and UK had the same value.
The analysis of 16S nucleotide sequences of O.paracephala using DnaSP ver.6.0 was made after the 16S sequences of O.paracephala from Tekolok Estuary was parallelized with the standard 16S sequences of O.paracephala recorded at GenBank. Within Tekolok Estuary population with 599 bp fragment length, two haplotypes with two variable sites and one parsimony informative site were identified from seven samples of O.paracephala investigated in this study. Next, among three populations of O.paracephala investigated in this study and combined with O.paracephala from GenBank database with 551 bp fragment length, three haplotypes with five variable sites and one parsimony informative site were detected (Table 2 and Table 3). The level of divergence among haplotypes was low with haplotypes differing between 1 bp to 4 bp. The variable sites contained three transitions and two transversions. No insertion and deletion were found on O.paracephala from Tekolok Estuary, Japan and UK recorded at GenBank database. Next, haplotype diversity and nucleotide diversity were 0.556 and 0.002 respectively. In addition, five samples of O.paracephala from Tekolok Estuary (LTK 03-07) have identical 16S sequences with O.paracephala from Japan (AB079256) which exhibited that both populations have similar haplotype.
The analysis of mt-DNA 16S sequence using Median Joining Network using NETWORK ver. 10 revealed the haplotype networking among the O.paracephala from (West Nusa Tenggara, Indonesia) and O.paracephala from other countries (Figure 4). One and other haplotypes were separated with 1 mutation point except for the O.paracephala from UK which was separated with 4 mutation points. This data supported the variable sites between one and another population of O.paracephala showed in Table 2.
The separation among haplotypes determined in Figure 4 was also supported by the phylogenetic tree using Neighbour-Joining (NJ) and Maximum Likelihood (ML) methods (Figure 5). The phylogenetic tree revealed the separation among haplotype-1 (LTK-01 and LTK-02), haplotype-2 (LTK 03-07 and AB079725), and haplotype-3 (KF415426). The separation among the haplotypes was supported by genetic distance between one and other haplotypes. The analysis of Pairwise Distance Calculation with the Kimura 2 parameter (K2P) model revealed that the genetic distance within O.paracephala from Tekolok Estuary was between 0-0.182 (average=0.087 %) whereas the intraspecific genetic distance of O.paracephala from Tekolok Estuary (West Nusa Tenggara, Indonesia) and O.paracephala from other countries (Japan and UK) was between 0-0.913 % (average=0.223 %). In addition, the genetic distance between O.paracephala from Tekolok Estuary and O.paracephala from UK was slightly higher than that from Japan. This finding revealed that O.paracephala from Tekolok Estuary (West Nusa Tenggara, Indonesia) and Japan was close genetically.
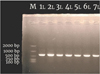 |
Fig. 3 PCR amplification of 16S mitochondrial gene fragments generated by primers (16Sar and 16Sbr) from O.paracephala collected from Tekolok Estuary and coded with LTK (M= size marker 2000 bp, 1L=LTK-01, 2L=LTK-02, 3L=LTK-03, 4L=LTK-04, 5L=LTK-05, 6L=LTK-06, and 7L=LTK-07) |
The average composition of 16S nucleotide of O.porocephala
Summary of nucleotide variations in the partial 16S mitochondrial gene of O.paracephala. Only variable sites are shown. Dots indicate identity with the O.paracephala sequence taken from GenBank with accession number AB079256 as a reference. The number above corresponds to nucleotide base pair position.
Haplotype data of O.paracephala from Tekolok Estuary and GenBank database based on 16S mitochondrial gene
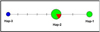 |
Fig. 4 Construction of Median Joining Network from 599 bp 16S sequence of O.paracephala. Each haplotype is represented by a circle and sizes of circles are relative to the number of individuals sharing a specific haplotype. Haplotypes are labelled according to the population (Green=Tekolok Estuary, Red=Japan, Blue=UK). |
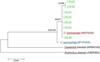 |
Fig. 5 Phylogenetic tree of O.paracephala inferred from DNA sequences of 16S mitochondrial gene. The number of each node represent bootstrap NJ (left) and ML (right). Scale corresponds to substitution/site. LTK is sample code of O.porocephala from Tekolok Estuary and other O. porocephala was taken from GenBank. |
4 Conclusion
The analysis using DnaSP and NETWORK revealed the intra-population and intraspecific polymorphism of O.paracephala based on 16S mitochondrial gene. In addition, this finding identified the close genetic relationship between O.paracephala from Tekolok Estuary (NTB, Indonesia) and O.paracephala from Japan.
The authors are grateful to Head of Laboratory of Genetics and Breeding, Faculty of Biology, Universitas Gadjah Mada for providing research facilities. This research has been supported by RTA- UGM 2020 funding with contract No. No. 2488/UN1.P.III/DIT-LIT/PT/2020.
References
- B. Peng, H.S. Chen, L.E. Mechanic, B. Racine, J. Clarke, E. Gillanders, E.J. Feuer. Genetic Epidemiology, 39, 1, 2-10 (2015). DOI:10.1002/gepi.21876 [CrossRef] [PubMed] [Google Scholar]
- K.A. Saravanan, M. Panigrahi, H. Kumar, B. Bhushan. Biological Rhythm Research (2019). DOI: 10.1080/09291016.2019.1642650 [PubMed] [Google Scholar]
- J. Rozas, A. Ferrer-Matta, J.C. Sanchez-DelBarrio, S. Guirao-Rico, P. Librado, S.E. ramos-Onsins, A. Sanchez-Gracia. Molecular Biology and Evolution 32, 12, 3299-3302 (2017) [Google Scholar]
- J. Gong, R. Zhao, J. Deng, Y. Zhao, J. Zou, L. Huang, M. Jing. Mitochondrial DNA Part A 29, 8, 1261-1268 (2018). DOI: 10.1080/24701394.2018.1444039 [CrossRef] [Google Scholar]
- R.V. Paixao, J. Ribolli, E. Zaniboni-Filho. Frontiers in Genetics, 9, article 48 (2018) [Google Scholar]
- X. Li, Y. Deng, K. Yang, W. Gan, R. Zeng, L. Deng. PLoS ONE 11, 12, e0166769 (2016). DOI:10.1371/journal.pone.0166769 [Google Scholar]
- D.M. Cawthorn, H.A. Steinman and R.C. Witthuhn. Gene 491, 1, 40-48 (2012) [Google Scholar]
- S.R. Palumbi. Nucleid acids II: The Polymerase Chain Reaction In D.M. Hillis, C. Moritz, B.K. Mable (eds.), Molecular Systematic Second Edition (Sinauer Associates Inc., Sunderland, Massachusetts, 1996), pp. 205-247 [Google Scholar]
- T. Arisuryanti, R.L. Hasan, K.L. Ayu, N. Ratman, L. Hakim. Journal of Tropical Biodiversity and Biotechnology 4, 3, 107-112 (2019). DOI: 10.22146/jtbb.46256 [CrossRef] [Google Scholar]
- W.P. Maddison, D.R. Maddison. (http://www.mesquiteproject.org), (2018) [Google Scholar]
- S. Kumar, G. Stecher, M. Li, C. Knyaz, K. Tamura. Molecular Biology and Evolution 35, 1547-1549 (2018). DOI: 10.1093/molbev/msy096 [CrossRef] [PubMed] [Google Scholar]
- L. Yan, Y. She, M.A. Elzo, C. Zhang, X. Fang, H. Chen. Archives Animal Breeding, 62, 1, 325-333 (2019) [CrossRef] [PubMed] [Google Scholar]
All Tables
Summary of nucleotide variations in the partial 16S mitochondrial gene of O.paracephala. Only variable sites are shown. Dots indicate identity with the O.paracephala sequence taken from GenBank with accession number AB079256 as a reference. The number above corresponds to nucleotide base pair position.
Haplotype data of O.paracephala from Tekolok Estuary and GenBank database based on 16S mitochondrial gene
All Figures
|
Fig. 1 Sample collection sites (1) of Ophiocara porocephala at Tekolok Estuary, West Nusa Tenggara |
| In the text | |
|
Fig. 2 Ophiocara porocephala collected from Tekolok Estuary (Documented by Lukman Hakim) |
| In the text | |
|
Fig. 3 PCR amplification of 16S mitochondrial gene fragments generated by primers (16Sar and 16Sbr) from O.paracephala collected from Tekolok Estuary and coded with LTK (M= size marker 2000 bp, 1L=LTK-01, 2L=LTK-02, 3L=LTK-03, 4L=LTK-04, 5L=LTK-05, 6L=LTK-06, and 7L=LTK-07) |
| In the text | |
|
Fig. 4 Construction of Median Joining Network from 599 bp 16S sequence of O.paracephala. Each haplotype is represented by a circle and sizes of circles are relative to the number of individuals sharing a specific haplotype. Haplotypes are labelled according to the population (Green=Tekolok Estuary, Red=Japan, Blue=UK). |
| In the text | |
|
Fig. 5 Phylogenetic tree of O.paracephala inferred from DNA sequences of 16S mitochondrial gene. The number of each node represent bootstrap NJ (left) and ML (right). Scale corresponds to substitution/site. LTK is sample code of O.porocephala from Tekolok Estuary and other O. porocephala was taken from GenBank. |
| In the text | |
Current usage metrics show cumulative count of Article Views (full-text article views including HTML views, PDF and ePub downloads, according to the available data) and Abstracts Views on Vision4Press platform.
Data correspond to usage on the plateform after 2015. The current usage metrics is available 48-96 hours after online publication and is updated daily on week days.
Initial download of the metrics may take a while.