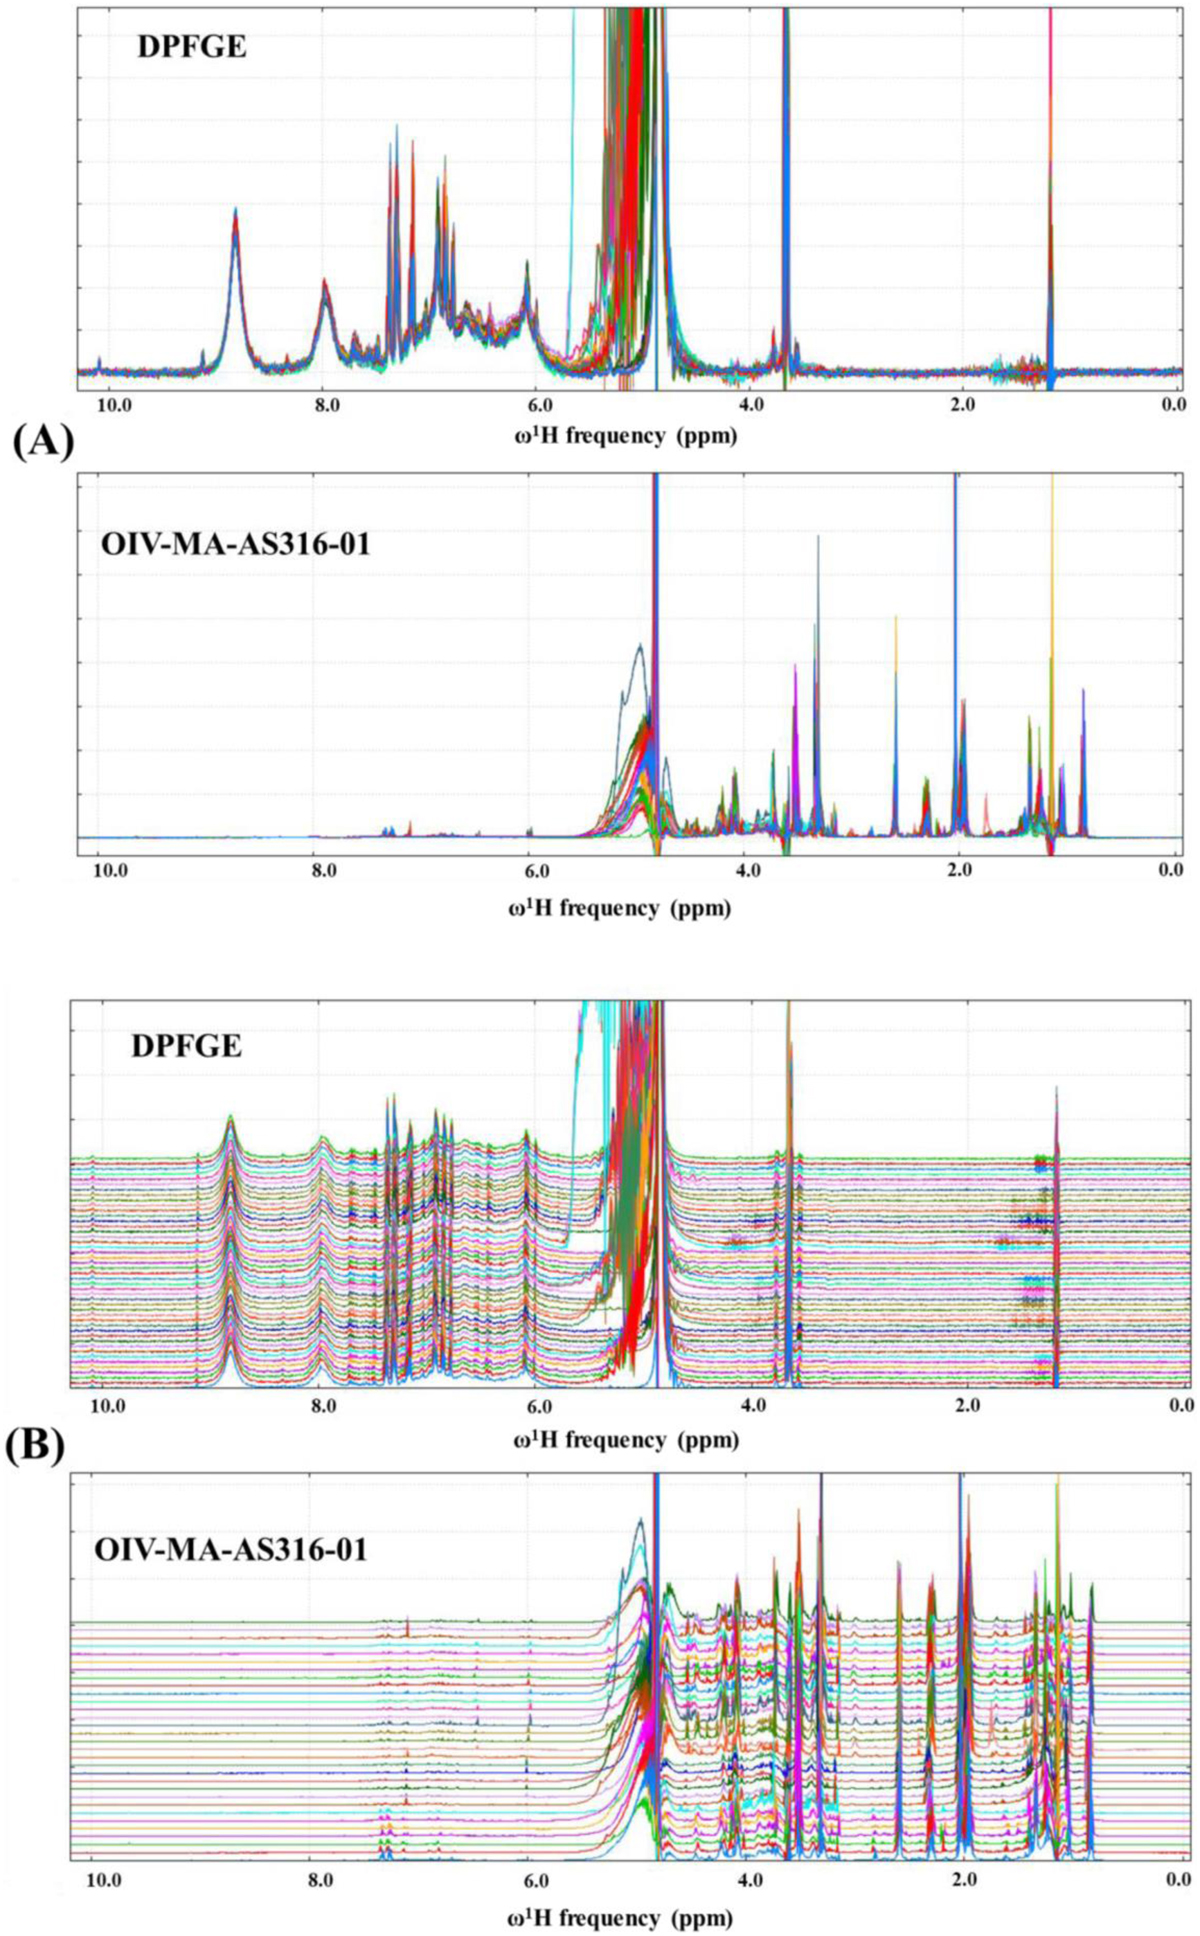
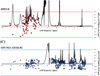
Figure 3
Download original image
(A) Overlaid NMR spectra that defines DPFGE (top) and OIV-MA-AS316-01 (bottom) metabolomics outliers; (B): Stacked NMR spectra that defines DPFGE (top) and OIV-MA-AS316-01 (bottom) metabolomics outliers and (C): OPLS-DA loading p[1] S-plots of DPFGE (top) and OIV-MA-AS316-01 (bottom) data matrixes, as a function of 1H –NMR chemical shifts, indicating the importance of relevant metabolites to respectively discriminate fermentation schemes of wines from same variety -geographical origin and geographical origins of wines from diverse grape varieties and year of vintages.
Current usage metrics show cumulative count of Article Views (full-text article views including HTML views, PDF and ePub downloads, according to the available data) and Abstracts Views on Vision4Press platform.
Data correspond to usage on the plateform after 2015. The current usage metrics is available 48-96 hours after online publication and is updated daily on week days.
Initial download of the metrics may take a while.