Open Access
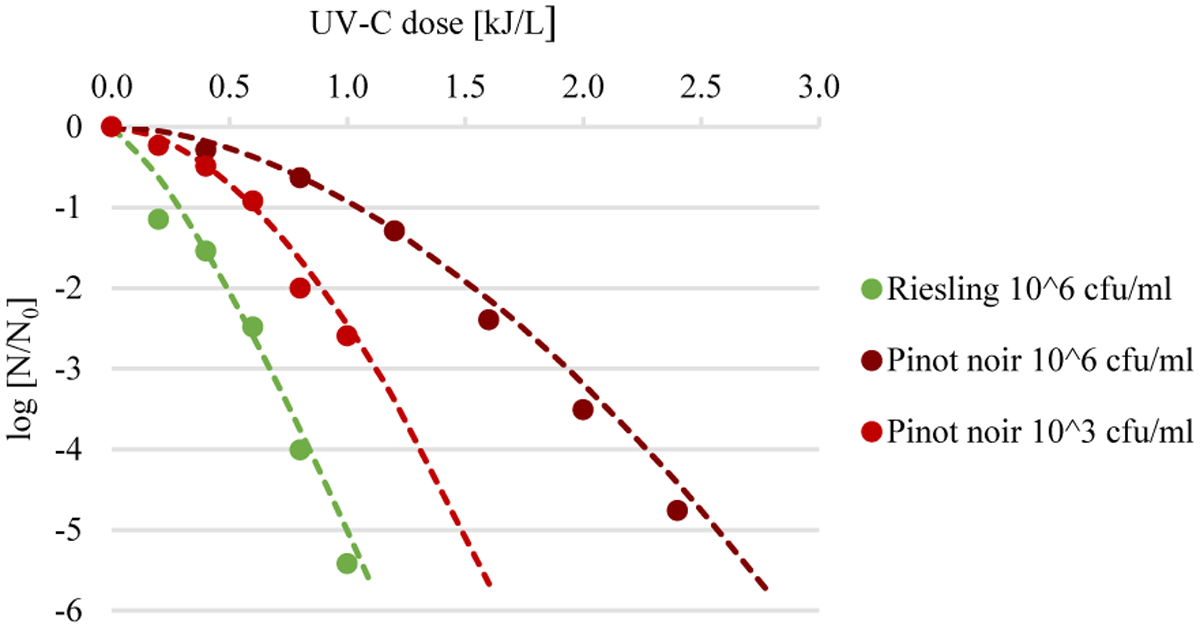
Figure 1.
Download original image
Inactivation kinetics of D. bruxellensis with increasing UV-C doses for different inoculation numbers in Riesling and Pinot noir wine. The dotted curves show the inactivation kinetics as determined by the Weibull model.
Current usage metrics show cumulative count of Article Views (full-text article views including HTML views, PDF and ePub downloads, according to the available data) and Abstracts Views on Vision4Press platform.
Data correspond to usage on the plateform after 2015. The current usage metrics is available 48-96 hours after online publication and is updated daily on week days.
Initial download of the metrics may take a while.