Figure 4
Download original image
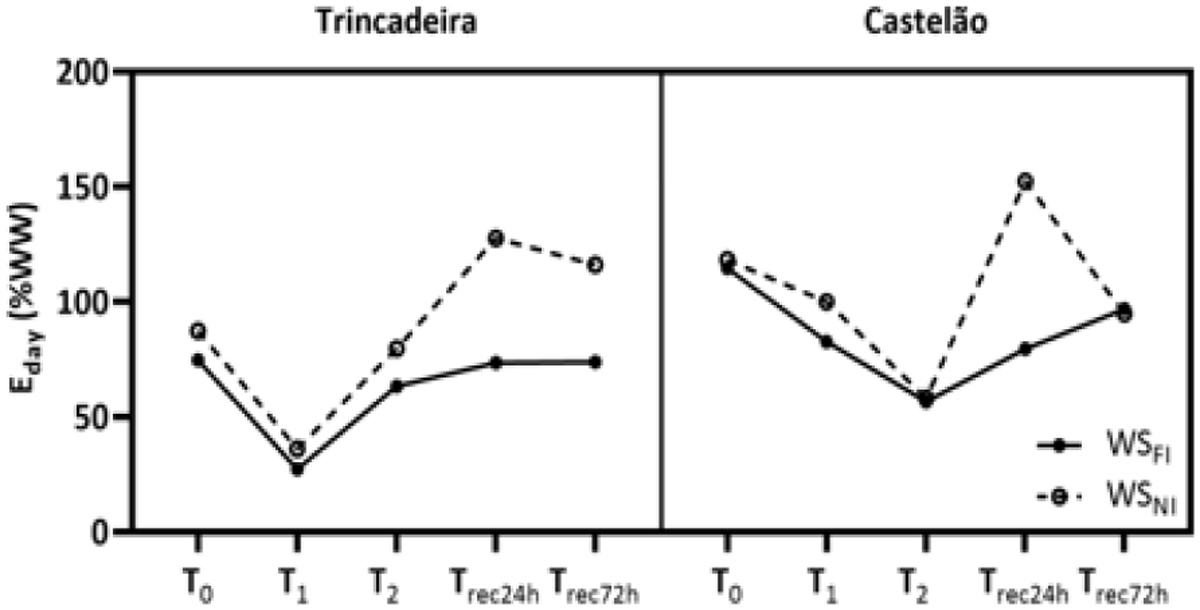
Rate of Transpiration (E) in the five time points of the experiment (T0, the beginning of the experiment; T1 and T2, the water stress treatment; Trec24h and Trec48h, the recovery), in Trincadeira and Castelão plants of the Full Irrigated (FI) and non Irrigated (NI) progenies. Values were measured in g H2O cm-2 d-1, and are presented as percentage of the respective Well Watered (WW) treatment value.
Current usage metrics show cumulative count of Article Views (full-text article views including HTML views, PDF and ePub downloads, according to the available data) and Abstracts Views on Vision4Press platform.
Data correspond to usage on the plateform after 2015. The current usage metrics is available 48-96 hours after online publication and is updated daily on week days.
Initial download of the metrics may take a while.