Open Access
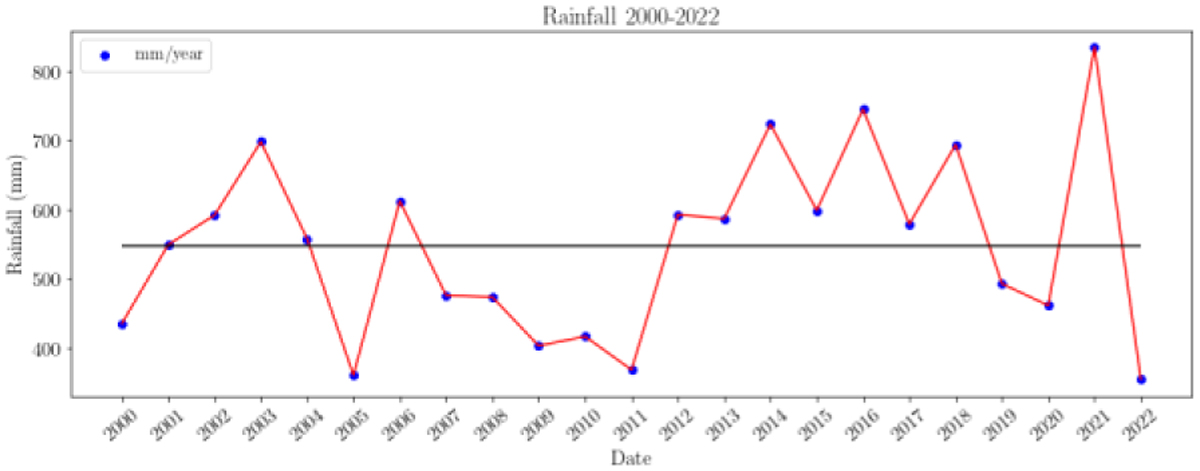
Figure 13
Download original image
Yearly timeseries rainfall from 2000 to 2022 over the vineyards’ area of Querétaro. The black line represents the average value.
Current usage metrics show cumulative count of Article Views (full-text article views including HTML views, PDF and ePub downloads, according to the available data) and Abstracts Views on Vision4Press platform.
Data correspond to usage on the plateform after 2015. The current usage metrics is available 48-96 hours after online publication and is updated daily on week days.
Initial download of the metrics may take a while.