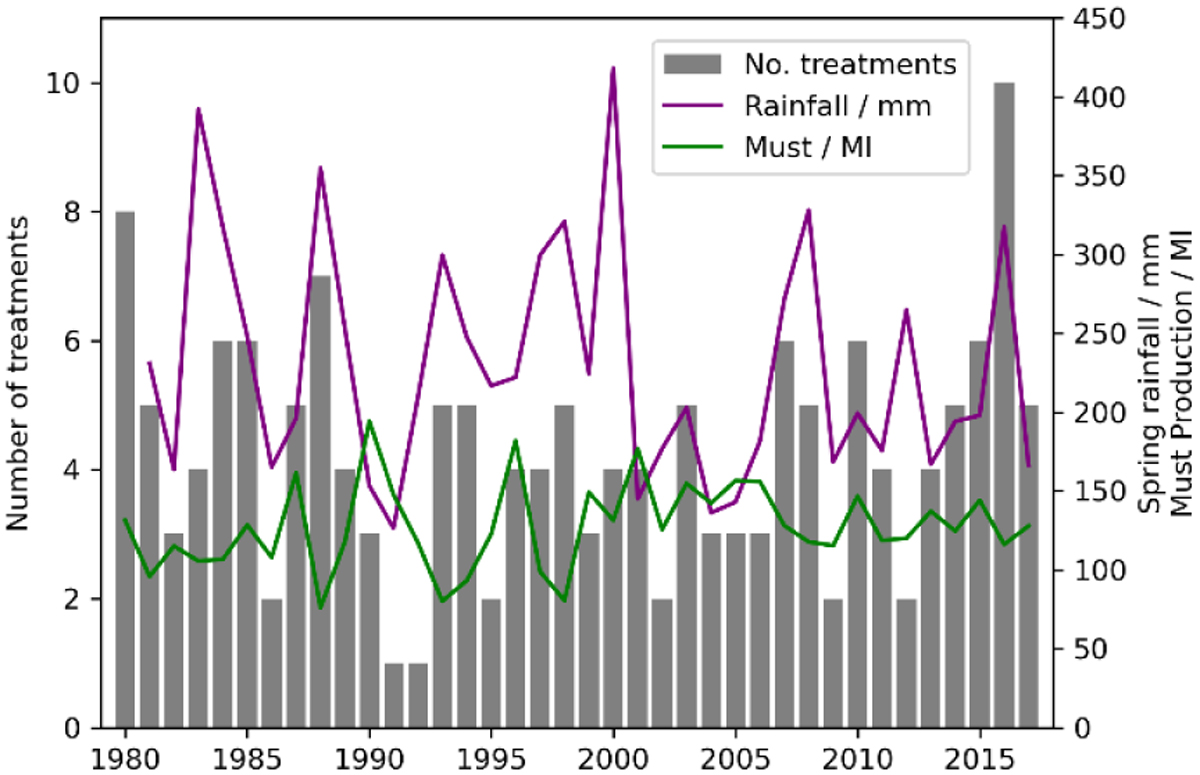
Figure 2.
Download original image
Historical series of total rainfall for late spring (April-June) over northern Portugal (purple line). Very high rainfall totals are seen in 1983, 1988, 1993, 2008 and 2016. Also shown are total grape must production in millions of litres (Ml; green line) and numbers of phytosanitary treatments recommended to control mildew and other fungal infestations (grey bars).
Current usage metrics show cumulative count of Article Views (full-text article views including HTML views, PDF and ePub downloads, according to the available data) and Abstracts Views on Vision4Press platform.
Data correspond to usage on the plateform after 2015. The current usage metrics is available 48-96 hours after online publication and is updated daily on week days.
Initial download of the metrics may take a while.