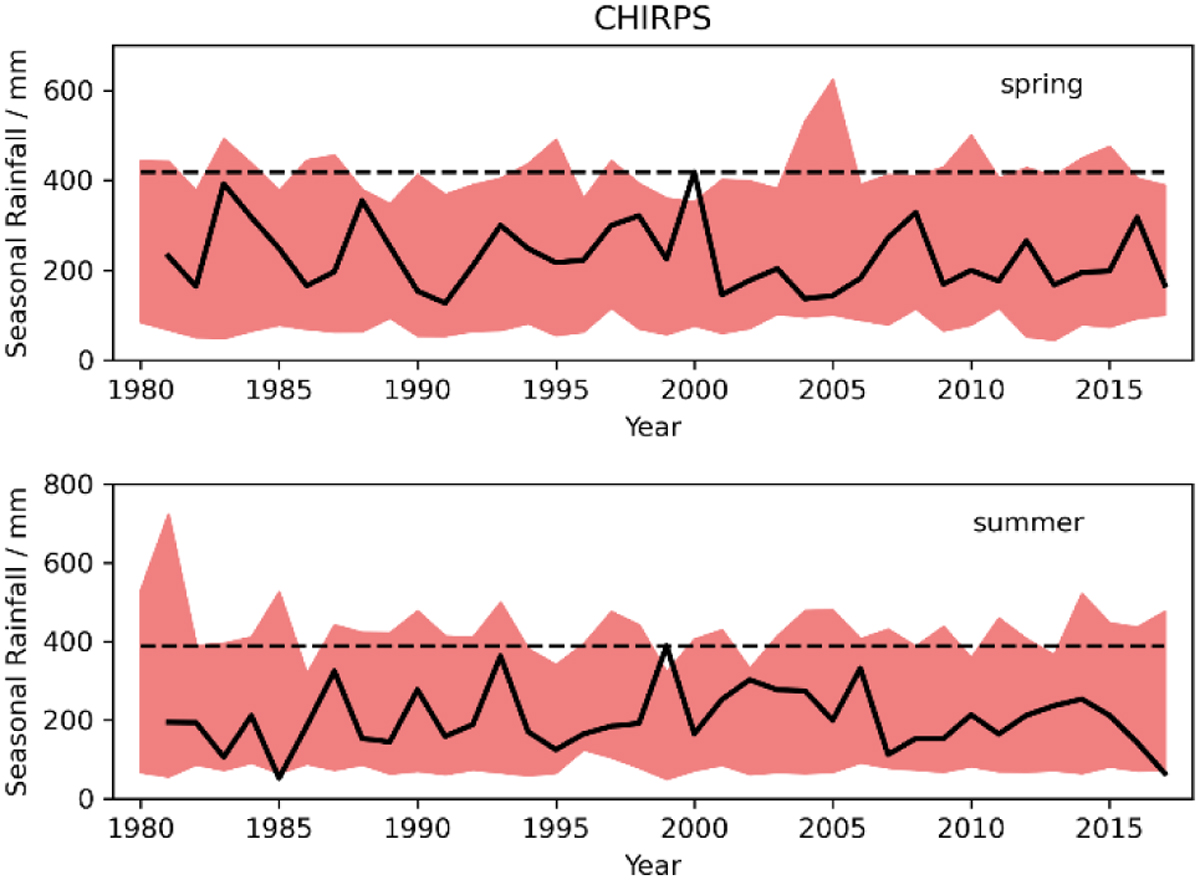
Figure 6.
Download original image
Seasonal rainfall totals for spring (April to June) and summer (April to October) in northern Portugal from 1980 to 2017. The shaded areas represent rainfall totals from the bias-corrected hindcasts. The solid black lines show observed rainfall totals from CHIRPS [15], and the dashed black lines indicate the highest observed values. Unprecedented rainfall totals are apparent when the modelled rainfall totals lie above the dashed line in each panel.
Current usage metrics show cumulative count of Article Views (full-text article views including HTML views, PDF and ePub downloads, according to the available data) and Abstracts Views on Vision4Press platform.
Data correspond to usage on the plateform after 2015. The current usage metrics is available 48-96 hours after online publication and is updated daily on week days.
Initial download of the metrics may take a while.