Open Access
Figure 4
Download original image
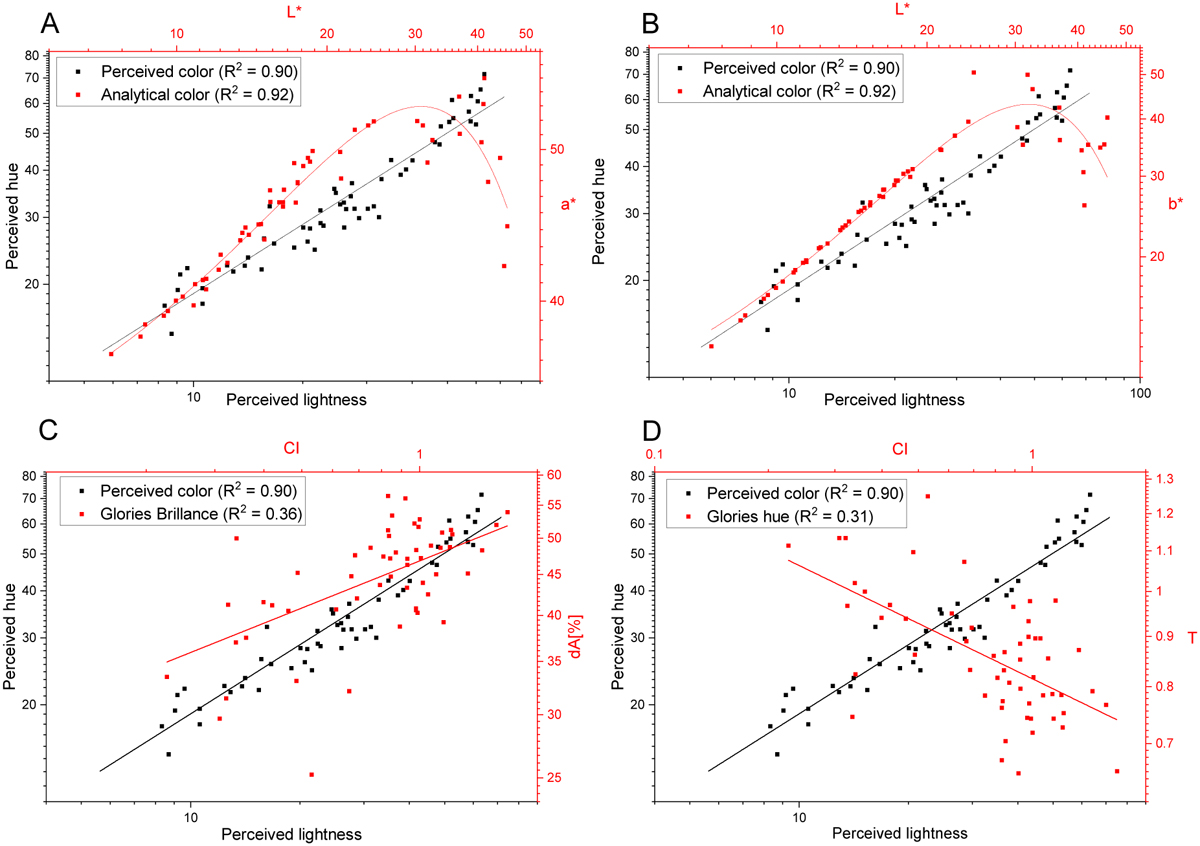
Regressions of perceived hue and perceived lightness compared to the regressions of the L*a* projection (A), L*b* projection (B), Glories’ CI and T (C), as well as Glories CI and dA(%) (D) in red wine.
Current usage metrics show cumulative count of Article Views (full-text article views including HTML views, PDF and ePub downloads, according to the available data) and Abstracts Views on Vision4Press platform.
Data correspond to usage on the plateform after 2015. The current usage metrics is available 48-96 hours after online publication and is updated daily on week days.
Initial download of the metrics may take a while.