| Issue |
BIO Web Conf.
Volume 15, 2019
42nd World Congress of Vine and Wine
|
|
|---|---|---|
| Article Number | 02017 | |
| Number of page(s) | 6 | |
| Section | Oenology | |
| DOI | https://doi.org/10.1051/bioconf/20191502017 | |
| Published online | 23 October 2019 | |
Cork powder as a new natural and sustainable fining agent to reduce negative volatile phenols in red wine
1 Chemical Department, Chemistry Research Centre – Vila Real (CQ-VR), Food and Wine Chemistry Lab, University of Trás-os-Montes and Alto Douro, 5001-801 Vila Real, Portugal
2 Biology and Environmental Department, University of Trás-os-Montes and Alto Douro, 5001-801 Vila Real, Portugal
a e-mail: This email address is being protected from spambots. You need JavaScript enabled to view it.
Abstract
In red winemaking, especially those aged in wood barrels, the contamination and growth of Dekkera/Brettanomyces yeasts results in the formation of 4-ethylphenol (4-EP) and 4-ethylguaiacol (4-EG). These volatile phenols (VPs) are responsible for negative aromatic notes like horsy, barnyard, smoky and medicine, decreasing significantly red quality and its commercial value. In this work, cork powder waste was especially prepared and used to remove these negative volatile phenols (4-EP and 4-EG) from spiked red wine. The optimisation of cork powder performance by removal of dichloromethane and ethanol cork extractives, air removal and ethanol impregnation, allowed to obtain 41 to 62% of 4-ethylphenol and 50 to 53% of 4-ethylguaiacol removal from VPs spiked red wine applied at 250 g/hL. There was no significant impact on phenolic acids and monomeric anthocyanins, although being observed a decrease in the headspace aroma abundance (40%). This optimised cork powder allowed to decrease significantly the wine negative phenolic character, bitterness and astringency, recovering the positive fruity and floral sensory attributes. Results show that optimised cork powder can be a good solution for VPs removal, presenting a great potential to be a new oenological fining agent, contributing to the wine industry sustainability.
© The Authors, published by EDP Sciences, 2019
 This is an Open Access article distributed under the terms of the Creative Commons Attribution License 4.0, which permits unrestricted use, distribution, and reproduction in any medium, provided the original work is properly cited.
1. Introduction
The contamination and growth of Dekkera/Brettanomyces yeasts in red wine results in the formation of 4-ethylphenol (4-EP) and 4-ethylguaiacol (4-EG) by decarboxylation of p-coumaric and ferulic acids present in wine and subsequent reduction of the correspondent vinylphenols [1, 2]. These volatile phenols (VPs) are responsible for negative aromatic notes like horsy, barnyard, smoky and medicinal [1, 3]. This important sensory defect has been reported in numerous wine styles around the world, mainly, premium wines [4], considered negative by professionals, consumers and wine industry [5, 6] and thus VPs are a global problem in winemaking. For these reasons several preventive and remedial treatments have been tested. Preventive action includes for example the maintenance of adequate levels of SO2 throughout the winemaking process, reduction/elimination of oxygen levels in wine, use of dimethyldicarbonate (DMDC) before bottling and the addition of fungal chitosan are some of the measures that have found some degree of success [7, 8]. Several remediation treatments have also been developed to remove from wine the already formed VPs or to reduce the headspace content by reducing their partition coefficients to the gas phase without changing the total VPs content of wines. Of these methods, those tested in wines presenting good removal efficiency at practical application doses are activated carbons [9, 10], potassium caseinate [11], egg albumin [11] and esterified cellulose [12]. A previous work in a model wine solution using cork pieces (20 mm long, 10 mm wide and 2 mm thick) have shown that at 3333 g/hL application dose, cork was able to remove 39% of 4-EP and 32% of 4-EG [13]. Thus, the aim of this work was to explore the possibility of using cork powder by-product, in its natural form and after its optimisation by simple physicochemical treatments, as a new cheap and sustainable wine fining agent for removing VPs from contaminated red wines, reducing its “Brett character”. Also, its impact on the chemical wine composition and sensory profiles were evaluated.
2. Material and methods
2.1. Cork samples and preparation
Cork powder with an average particle size of 372 μm (interquartile range 1009–137 μm) was obtained from a local cork stoppers producer and supplied by SAI Enology (Paredes, Portugal). Natural cork powder (CKN) was extracted with dichloromethane by soxhlet extraction overnight (24 h) followed by a second soxhlet extraction overnight with (24 h) ethanol for extracting the corresponding cork extractives (CKF). For obtaining dichloromethane and ethanol extractive free cork powder with a particle size below 75 μm (CKF75), CKF was sieved through a screen sieve. For removing the air enclosed in the cork powder and simultaneously impregnate the material with ethanol (CKNI, CKFI and CKFI75), a proportion 0.250 g cork were immersed in 5 mL of ethanol and the suspension was vacuum degassed (0.00131 atm) by repeated cycles (11 times) of vacuum and vacuum release. After impregnation the cork powders were allowed to stand 12 h in contact with ethanol (96% v/v). After this time the ethanol was removed by centrifugation (10 min, 10.956 g, 20 ∘C). The cork sediment obtained was used for the wine fining experiments.
2.2. Cork powder samples physicochemical characterisation
2.2.1. Cork powder textural characterisation
Cork powders (CKN, CKF and CKFI75) were characterised in terms of their texture (surface area, porosity, and pore-size distribution). The texture characteristics were carried out by gas adsorption. The samples were first oven dried at 150 ∘C for 5 h. The adsorption isotherms for N2 (purity >99.998%) at − 196 ∘C were determined using a semiautomatic adsorption apparatus Quantachrome Nova4200e.
2.2.2. FTIR analysis
Natural cork powder (CKN) and dichloromethane and ethanol extractive free cork powder (CKF) FTIR spectra were recorded in the range of wavenumbers 4000–450 cm−1, and 128 scans were taken at 2 cm−1 resolution using a Unicam Research Series FTIR spectrometer. KBr pellets were used.
2.2.3. X-ray diffraction analysis
Powder X-ray diffraction (XRD) data were recorded on solid samples using a PANalytical X'Pert Pro X-ray diffractometer equipped with an X'Celerator detector and secondary monochromator. The measurements were performed using Cu Kα radiation (40 kV; 30 mA) in Bragg–Bentano geometry at a 7–60∘ 2θ angular range.
2.2.4. Determination of cork powder structure by scanning electron microscopy (SEM)
Cork powder samples morphology was analysed using the FEI Quanta 400 Scanning Electron Microscope (FEI Company, USA) in environmental mode at 1.33 mbar using a Large Field Detector (LFD). Cork powder samples were applied on carbon glue and let dry at room temperature. An accelerating voltage of 15 kV was used.
2.2.5. Determination of the accessible area using the iodine number
The determination of iodine number was performed according to the European Council of Chemical Manufacturers Federations protocols [14].
2.3. Characteristics of the wine
Red wine from Douro Valley (vintage 2016) were used in this work. The main characteristics of the wine used: alcohol content (% v/v) 13.0, specific gravity (20 ∘C) (g/mL) 0.9920, titratable acidity (g tartaric acid/L) 5.8, pH 3.77, and volatile acidity (g acetic acid/L) 0.56. Analyses were performed in duplicate.
2.4. Experimental design
To study the performance of cork powders on removal of VPs from spiked wines five different cork powder samples were used at 250 g/hL (CKN, CKNI, CKF, CKFI, CKFI75250) and for the CKFI75 an application dose of 500 g/hL was used (CKFI75500). The wine was previously spiked at two levels of 4-EP (750 and 1500 μg/L – medium and high, levels, respectively) and 4-EG (150 and 300 μg/L – medium and high levels, respectively) according to the ranges usually found in the literature [1, 15]. Corks were applied at 250 g/hL and one of them at 500 g/hL (CKFI75500) for the wine added to 100-mL plastic cups. After 6 days, the wine was centrifuged at 10.956 g, 10 min and 20 ∘C for analysis. All experiments were performed in duplicate.
2.5. Liquid-liquid extraction
The liquid-liquid extraction were performed using the methodology described by Milheiro et al. [11], 2 mL of internal standard (3,4-dimethylmephol 10 mg/L) was added to 20 mL of centrifuged red wine placed in a falcon tube. Then, 2 mL of organic solvent (pentane/diethyl ether 2:1) was added and this mixture was shaken horizontally for 15 min at 400 rpm. Afterwards, the falcon tube was centrifuged during 10 min at 4 ∘C and 12000 rpm. Finally, the organic layer was recovered and analysed by GC-MS. All the determinations were repeated four times.
2.6. SPME analysis
The headspace aroma abundance was performed using a validated method, previously tested in our laboratory [16]. Briefly the fibre used was coated with Divinylbenzene/Carboxen/Polydimethylsiloxane 50/30 μm (DVB/CAR/PDMS) and was conditioned before use by insertion into the GC injector at 270 ∘C for 60 min. To a 20 mL headspace vial, 10 mL of wine treated with the different cork powders, 2.5 g/L of NaCl and 50 μL (500 mg/L) of 3-octanol us an internal standard were added. The vial was sealed with a Teflon septum. The selected fibre was inserted through the vial septum and exposed during 60 min to perform the extraction by an automatic CombiPal system. The fibre was inserted into the injection port of the GC during 3 min at 270 ∘C. All analyses were performed in quadruplicate.
2.7. GC-MS analysis
Gas chromatographic analyses were performed using a Trace GC Ultra as GC system with a Polaris Q mass spectrometer and equipped with an AS 3000 autosampler. Injections of 5 μL were in the splitless mode during 2 min. Separation was carried out using a ZB-5 Inferno column (30 m × 0.25 mm, 0.25 μm film thickness) with a flow-rate of 1 mL/min of helium as a carrier gas. The oven temperature program was: 40 ∘C for 5 min then raised to 155 ∘C at 5 ∘C/min, then raised for 300 ∘C at 20 ∘C/min and held at that temperature for 1 min, while the temperature of the injector was 250 ∘C. The mass spectrometer was operated with selected-ion-monitoring (SIM) mode. Monitored ions are: m/z 107 for 4-ethylphenol, m/z 122 for 3,4-dimethylphenol and m/z137 for 4-ethylguaiacol. Identification ion is m/z 77. Quantification was performed by the internal standard method.
2.8. Quantification of non-flavonoids, flavonoids and total phenols
The wine phenolic content was quantified using the absorbance at 280 nm before and after precipitation of the flavonoid phenols, through reaction with formaldehyde, according to Kramling and Singleton [17]. The results were expressed as gallic acid equivalents by means of calibration curves with standard gallic acid. The total phenolic content was also determined by a spectrophotometric method, using a UV-vis spectrophotometer according to [18]. All analyses were performed in duplicate.
2.9. Sensory evaluation
Sensory analysis was performed by a panel composed by six experts [19]. Fifteen attributes were selected: visual (limpidity, hue, colour intensity and oxidised), aroma (fruity, floral, vegetable, phenolic and oxidised aroma) and taste and tactile/textural descriptors (taste – bitterness, acidity, tactile/textural – astringency, body, balance and persistence) using an adapted tasting sheet based on that recommended by the OIV (http://www.oiv.int/public/medias/3307/reviewonsensory-analysis-of-wine.pdf). All evaluations were conducted from 10:00 to 12:00 p.m. in an individual booth [20] using the recommended glassware according to [21].
2.10. Statistical treatment
Statistically significant differences between means were determined by analysis of variance (ANOVA, one-way) followed by Tukey's honestly significant difference (HSD, 5% level) post-hoc test for the physicochemical data and a post-hoc Duncan test for sensory data. All analyses were performed using Statistica 7 Software (StatSoft, Tulsa, OK U.S.A.). Multiple Factor Analysis (MFA, XLSTAT-RIB) was performed using XLSTAT (Addinsoft, Anglesey, UK).
3. Results and discussion
3.1. Physicochemical characterisation of cork material
Natural cork powder (CKN) was initially treated to remove the dichloromethane and ethanol cork extractives (9.9% of dichloromethane and ethanol extractives, CKF). The CKF was further sieved in other to obtain cork powder with a particle size below 75 μm (29% of the CKF, CKF75). The N2 adsorption isotherms were determined to evaluate the specific surface area and porosity features of these three cork powder samples. Isotherms of all cork powders are of Type III (Fig. 1), belong to the class of nonporous or macroporous solids, according to Brunauer classification [22]. The Table 1 presents the parameters obtained through analysis of the N2 isotherms by the BET equation and t- method. Natural cork powder (CKN) was initially treated to remove the dichloromethane and ethanol cork extractives (9.9% of dichloromethane and ethanol extractives, CKF). The CKF was further sieved in other to obtain cork powder with a particle size below 75 μm (29% of the CKF, CKF75). The N2 adsorption isotherms were determined to evaluate the specific surface area and porosity features of these three cork powder samples. Isotherms of all cork powders are of Type III [23], belong to the class of nonporous or macroporous solids, according to Brunauer classification [22]. The Table 1 adapted from Filipe-Ribeiro et al. [23], presents the parameters obtained through analysis of the N2 isotherms by the BET equation and t-method.
The cork powder samples presented very low SBET, although the CKF75 presented an almost 34-fold increase in this parameter. Also, the volume of micropores was very low, and again CKF75 presented a twofold increase in the micropore volume. These low values of SBET and volume of micropores of the cork samples are in accordance with previous results [24]. The FTIR bands, based on previous work [25]. These results show that the major components of the cork powder, namely suberin, lignin and polysaccharides, were not changed due to the extraction of CKN with dichloromethane and ethanol, and that sieving allowed to obtain cork particles with similar composition to the initial CKF [23]. The X-ray diffraction pattern of cork powder samples displayed a broad amorphous halo (broad halo centred ca. 2θ ≈ 21.2∘), typical of amorphous materials. In the original cork powder, some small but clear peaks are observed in the spectra that disappeared with the removal of dichloromethane and ethanol extractives [23]. By SEM analyses, the cork material is compact, devoid of intercellular spaces, and with a regular honeycomb organisation (Fig. 2). This material is composed by dead parenchymateous cells with voids, prismatic, air-filled interiors, hexagonal on average, and are arranged base-to-base in an alignment oriented in the tree's radial direction [26].
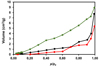 |
Figure 1. Adsorption isotherms of cork powders (N2, − 196 ∘C). Natural cork powder (CKN – black), dichloromethane and ethanol extractive free cork powder (CKF – red) and dichloromethane and ethanol extractive free cork powder with a particle size below 75 μm (CKF75 – green). |
Amount of 4-EP and 4-EG (μ g/L) removed from wines at two spiked levelsa of impregnated, dichloromethane and ethanol extractive free cork powders (CKFI) and cork powder below 75 μm size particles (CKFI75) at 250 g/hL application dose.
Amount of 4-EP and 4-EG (μg/L) removed from wines at two spiked levelsa with impregnated dichloromethane and ethanol extractive free cork powder with particles size below 75 μm (CKFI75) at 250 g/hL and 500 g/hL application dose.
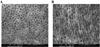 |
Figure 2. Structure of cork as observed by SEM in the two main sections: A) tangential section, perpendicular to the tree's radial direction; B) transverse section, perpendicular to the tree's axial direction (adapted from [27]). |
3.2. Evaluation and optimisation of cork performance to remove volatile phenols from red wine
CKN was able to reduce significantly the amount of VPs from spiked wine for both contamination levels. The removal efficiency of VPs increased with the contamination levels, nevertheless the percentage of VPs removal decreased with increased contamination level (4-EP 11% to 7.2% and 4-EG from 6.1% to 3.5%). The removal of extractives from the cork powder material with dichloromethane and ethanol (CKF) increased the removal efficiency of the cork material for both VPs and contamination levels (2.1 and 6.8 times higher removal, for the medium and high contamination level). Contrary to CKN, for CKF the percentage of VPs removal increased with the wine contamination levels (4-EP 22% to 49% and 4-EG 13% to 24%). As natural cork material contains significant amounts of air entrapped in its hollow parenchymateous death cellular structure, and water has a very small diffusion coefficient in cork [28] the air from cork samples (CKN and CKF) was removed and the cork was impregnated with ethanol by vacuum impregnation by repeated degassing cycles (11 times) of cork powder immersed in ethanol (CKNI, CKFI). The impregnation of cork with ethanol increased significantly the VPs removal efficiency for both CKN and CKF, although the increase was higher for CKNI than for CKFI when compared with the original cork material. For both impregnated cork materials (CKNI, CKFI), the removal efficiency increased with the wine spiked levels from 36% to 59% and 41% to 69% for 4-EP for CKNI and CKFI, respectively. The same trend was observed for 4-EG (29% to 45% and 40% to 50% for CKNI and CKFI, respectively. The Table 2 shows the amount of 4-EP and 4-EG removed by CKFI and CKFI75.
3.2.1. Effect of cork powder particle size and application dose on the removal of volatile phenols from red wine
In order to evaluate the effect of the particle size of the cork powder in the removal efficiency of ethanol impregnated cork free extractives (CKFI), CKF was sieved in order to obtain a particle size lower than 75 μm. The decrease in particle size increased only slightly, although significantly, the removal efficiency of VPs, except for 4-EP for the higher contamination level (Table 3). The increase in the application dose of CKFI from 250 g/hL to 500 g/hL only increased in average 21% and 33% removal for 4-EP and 4-EG, respectively (Table 3). These results suggest that although the amount of adsorbent added was increased twofold the removal efficiency of VPs only increased marginally, suggesting that probably some VPs are present in wine adsorbed more strongly with other wine components precluding their adsorption on the CKFI75.
3.3. Effect of natural, extractive free and solvent impregnated cork powder and application doses on abundance of headspace aroma compounds
The application of CKN to red wine didn't decrease significantly the total abundance of headspace aroma compounds in relation to spiked red wine (TF). As observed previously the air removal and ethanol impregnation of both cork samples increased significantly the decrease observed for the total headspace aroma abundance (CKNI 32% and CKFI 37%). Again, the decrease in the particle size of the CKF differ significantly on the removal of headspace aroma compounds relative to CKFI75250 [27]. The duplication in application dose of CKFI75 resulted in a significant decrease of the total abundance of headspace aroma by more 29% (Fig. 3).
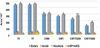 |
Figure 3. Impact on headspace aroma abundance of the different cork powders (CKNI, CKFI, CKFI75250, CKFI75500). |
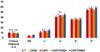 |
Figure 4. Impact of different cork powder treatments on chromatic characteristics (CKNI, CKFI, CKFI75250, CKFI75500). |
3.4. Effect of natural, extractive free and ethanol impregnated cork powder and application doses on wine chromatic characteristics and phenolic compounds
The impact on red wine chromatic characteristics was lower in almost of the cork powder treatments, where CKF75250 shows identical results in almost parameters comparative to the untreated wine (Fig. 4).
In total anthocyanins, there was observed only a significant difference in CKNI, relative to the untreated wine, with the other treatments presenting very low impact in this parameter (Fig. 5). Identical results were observed in malvidin-3-glucoside. On contrary, in total phenols were observed a significant difference (p < 0.05) between CKNI and CKFI, CKFI75250 and CKFI75500), with CKFI, CKFI75250 and CKFI75500, showing the lower total phenols content relative to the untreated wine, however the absolute total phenols content is slight different in all samples, that means that otimised cork powder does not change significantly, the red wine phenolic composition [27].
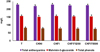 |
Figure 5. Effect of cork powder treatments on total anthocyanins (mg/L), malvidin-3-glucoside (mg/L) and total phenols (expressed in mg/L of gallic acid). |
3.5. Impact of wine chemical composition on sensory profile of red wine treated with extractive free and ethanol impregnated cork powder and application doses
There was observed a significant sensory quality improvement with cork powder treatment, principally with CKFI75250 relative to the spiked wine (TF) (Fig. 6). There was observed a significant difference (p < 0.05) in the fruity, floral and phenolic attributes between the 3 wines (T0, TF and CKFI75250). The wine that present better sensory performance was the untreated wine, next, was the wine treated with optimised cork powder (CKFI75250), that present more fruity and floral character relative to the spiked wine (TF), presenting at the same time less phenolic character. These results show the positive sensory effect of the treatment with the otimised cork powder.
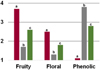 |
Figure 6. Sensory impact of cork powder treatment relative to untreated wine (scale 1–5) (T0 – burgundy colour), spiked red wine at medium contamination (TF – grey colour) and treated wine (CKFI75250 at 250 g/hL – green colour). |
4. Conclusions
Cork powder, an abundant by-product of the cork stopper industry, can be a cheap, natural, sustainable and highly efficient fining agent for removing VPs and to improve the sensory quality of VPs spiked wines. The cork powder efficiency was improved by removing the dichloromethane and ethanol extractives from cork and more importantly by removing air from cork parenchymateous cellular structure and replacing it by ethanol. Cork powders didn't impact strongly on wine phenolic acids and monomeric anthocyanins profile, nevertheless they had an impact on the aroma compounds, decreasing their headspace aroma abundance. However, there was observed a recover of the sensory quality in the treated wine, principally with CKFI75250, presenting more fruit and floral aroma, and the less phenolic character. These results show that otimised cork powder can be a good solution for the efficient removal of negative VPs, without impacting negatively on the red wine quality.
Acknowledgments
We acknowledge Aveleda S.A. for supplying the wine used in this study and SAI Enology Lda for providing the oenological samples. We appreciate the financial support provided to the Research Unit in Vila Real (PEst-OE/QUI/UI0616/2014) by FCT and COMPETE.
References
- P. Chatonnet, D. Dubourdieu, J. Boidron, M. Poins, J. Sci. Food Agric. 60, 165 (1992) [Google Scholar]
- P. Chatonnet, C. Viala, D. Dubourdieu, Am. J. Enol. Viticult. 48, 443 [Google Scholar]
- P. Ribéreau-Gayon, Y. Glories, A. Maujean, D. Dubourdieu, Handbook of Enology, Vol. 2. (Bordeaux, France, 2006) [CrossRef] [Google Scholar]
- S. Campolongo, H. Siegumfeldt, T. Aabo, L. Cocolin, L.N. Arneborg, LWT – Food Sci. Technol. 59, 1088 (2014) [CrossRef] [Google Scholar]
- M.R. Schumaker, M. Chandra, M. Malfeito-Ferreira, M.C.F. Ross. Food Res. Int. 100, 161 (2017) [CrossRef] [Google Scholar]
- S. Tempère, M.H. Schaaper, E. Cuzange, R. de Lescar, G. de Revel, G. Sicard, Food Qual. Prefer. 50, 135 (2016) [Google Scholar]
- C. Portugal, Y. Sáenz, B. Rojo-Bezares, M.M. Zarazaga, C. Torres, J. Cacho, F. Ruiz-Larrea, Eur. Food Res. Technol. 238, 641 (2014) [Google Scholar]
- R. Suárez, J.A. Suárez-Lepe, A. Morata, F. Calderón, F., Food Chem. 102, 10 (2007) [Google Scholar]
- L. Filipe-Ribeiro, J. Milheiro, C.C. Matos, F. Cosme, F.M. Nunes, Food Chem. 229, 242 (2017a) [Google Scholar]
- L. Filipe-Ribeiro, J. Milheiro, C.C. Matos, F. Cosme, F.F.M. Nunes, Data Brief. 12, 188 (2017b) [CrossRef] [PubMed] [Google Scholar]
- J. Milheiro, L. Filipe-Ribeiro, F. Cosme, F.M. Nunes, M.F.J. Chromatogr. B 1041–1042, 183 (2017) [CrossRef] [Google Scholar]
- R. Larcher, C. Puecher, S. Rohregger, M. Malacarne, G. Nicolini, Food Chem. 132, 2126 (2012) [Google Scholar]
- T. Karbowiak, A.K. Mansfield, V.D. Barrera-García, D. Chassagne, Food Chem. 122, 1089 (2010) [Google Scholar]
- CEFIC, Test Methods for Activated Carbon (1986) [Google Scholar]
- A.P. Pollnitz, K.H. Pardon, M.A. Sefton, J. Chromatogr. A 874, 101 (2000) [CrossRef] [PubMed] [Google Scholar]
- G. Vás, L. Gál, J. Harangi, A. Dobó, K. Vékey, J. Chromatogr. Sci. 36, 505 (1998) [Google Scholar]
- T.E Kramling, V.L. Singleton, Am. J. Enol. Vitic. 20 (1969) [Google Scholar]
- P. Ribéreau-Gayon, E. Peynaud, P. Sudraud, Science et Techniques du Vin, Tome 4. Dunod (Paris, 1982) [Google Scholar]
- ISO 6658, Sensory Analysis – Methodology – General guidance (1985) [Google Scholar]
- ISO 8589, Sensory analysis General guidance for the design of test rooms. Retrieved November 20 2008 from http://www.iso.org/iso/iso_catalogue/catalogue_ics/catalogue_detail_ics.htm%3Fcsnumbr%3D36385 (2007) [Google Scholar]
- ISO 3591, Sensory analysis-apparatuseWine-tasting glass, Retrieved November 20 2008 from http://www.iso.org/iso/rss.xml%3Fcsnumber%3D9002%26rss%3Ddetail (1977) [Google Scholar]
- S.J. Gregg, K.S.W. Sing, Adsorption, Surface Area, and Porosity, 2nd ed. (Academic Press, London, 1991), p. 303 [Google Scholar]
- L. Filipe-Ribeiro, F. Cosme, F.M. Nunes, ACS Sustain Chem. Eng. 7, 1105 (2019a) [Google Scholar]
- A.M.A. Pintor, A.M. Silvestre-Albero, C.I.A. Ferreira, J.P.C. Pereira, V.J.P. Vilar, C.M.S. Botelho, F. Rodríguez-Reinoso, R.A.R. Boaventura, Ind. Eng. Chem. Res. 52, 16427 (2013) [Google Scholar]
- M.H. Lopes, A.S. Barros, C. Pascoalneto, D.I. Rutledge, A.M. Delgadillo, L. Gil, Biopolymers 62, 268 (2001) [CrossRef] [PubMed] [Google Scholar]
- H. Pereira, BioResources 10, 1 (2015) [CrossRef] [Google Scholar]
- L. Filipe-Ribeiro, F. Cosme, F.M. Milheiro, Air depleted and solvent impregnated cork powder as a new natural and sustainable wine fining agent, Book Chapter, IntechOpen, doi: 10.5772/intechopen.85691 (2019) [Google Scholar]
- A.L. Fonseca, C. Brazinha, H. Pereira, J.G. Crespo, O.M.D.N. Teodoro, J. Agric. Food Chem. 61, 9672 (2013) [CrossRef] [PubMed] [Google Scholar]
All Tables
Amount of 4-EP and 4-EG (μ g/L) removed from wines at two spiked levelsa of impregnated, dichloromethane and ethanol extractive free cork powders (CKFI) and cork powder below 75 μm size particles (CKFI75) at 250 g/hL application dose.
Amount of 4-EP and 4-EG (μg/L) removed from wines at two spiked levelsa with impregnated dichloromethane and ethanol extractive free cork powder with particles size below 75 μm (CKFI75) at 250 g/hL and 500 g/hL application dose.
All Figures
|
Figure 1. Adsorption isotherms of cork powders (N2, − 196 ∘C). Natural cork powder (CKN – black), dichloromethane and ethanol extractive free cork powder (CKF – red) and dichloromethane and ethanol extractive free cork powder with a particle size below 75 μm (CKF75 – green). |
| In the text | |
|
Figure 2. Structure of cork as observed by SEM in the two main sections: A) tangential section, perpendicular to the tree's radial direction; B) transverse section, perpendicular to the tree's axial direction (adapted from [27]). |
| In the text | |
|
Figure 3. Impact on headspace aroma abundance of the different cork powders (CKNI, CKFI, CKFI75250, CKFI75500). |
| In the text | |
|
Figure 4. Impact of different cork powder treatments on chromatic characteristics (CKNI, CKFI, CKFI75250, CKFI75500). |
| In the text | |
|
Figure 5. Effect of cork powder treatments on total anthocyanins (mg/L), malvidin-3-glucoside (mg/L) and total phenols (expressed in mg/L of gallic acid). |
| In the text | |
|
Figure 6. Sensory impact of cork powder treatment relative to untreated wine (scale 1–5) (T0 – burgundy colour), spiked red wine at medium contamination (TF – grey colour) and treated wine (CKFI75250 at 250 g/hL – green colour). |
| In the text | |
Current usage metrics show cumulative count of Article Views (full-text article views including HTML views, PDF and ePub downloads, according to the available data) and Abstracts Views on Vision4Press platform.
Data correspond to usage on the plateform after 2015. The current usage metrics is available 48-96 hours after online publication and is updated daily on week days.
Initial download of the metrics may take a while.