Fig.
Download original image
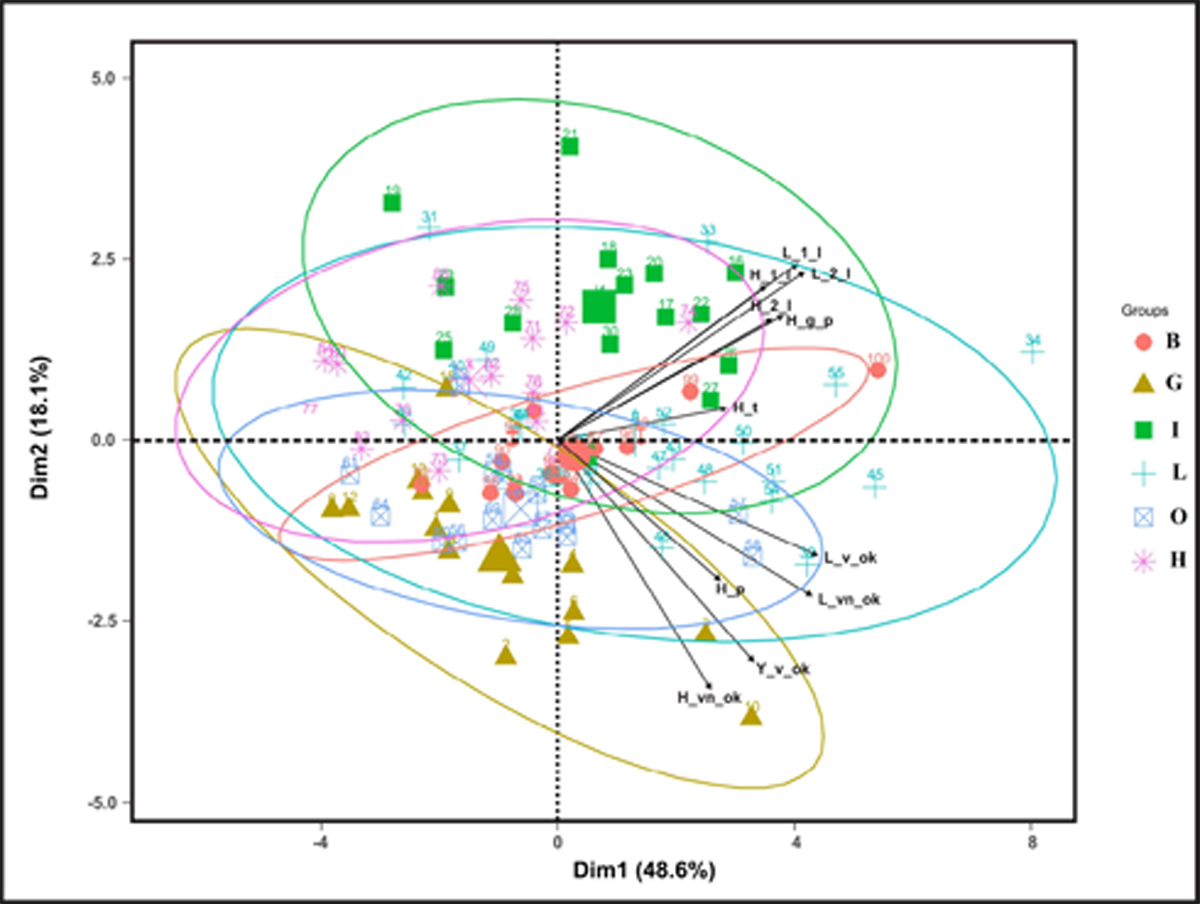
Scatter diagram characterizing the studied specimens of Tulipa uniflora in the space of the first two principal components. Ellipses outline the point clouds, the concentration of specimens from the certain populations. The vectors show the gradient direction of the change in the morphometric characters under study. The designation of populations is given in Table 1, the designation of the features is given in Table 2.
Current usage metrics show cumulative count of Article Views (full-text article views including HTML views, PDF and ePub downloads, according to the available data) and Abstracts Views on Vision4Press platform.
Data correspond to usage on the plateform after 2015. The current usage metrics is available 48-96 hours after online publication and is updated daily on week days.
Initial download of the metrics may take a while.