| Issue |
BIO Web Conf.
Volume 17, 2020
International Scientific-Practical Conference “Agriculture and Food Security: Technology, Innovation, Markets, Human Resources” (FIES 2019)
|
|
|---|---|---|
| Article Number | 00015 | |
| Number of page(s) | 4 | |
| DOI | https://doi.org/10.1051/bioconf/20201700015 | |
| Published online | 28 February 2020 | |
Technical devices used for differential fertilizer application
Samara State Agrarian University, Samara, 446442, Russia
* Corresponding author: This email address is being protected from spambots. You need JavaScript enabled to view it.
Abstract
The purpose of this article is to describe new technical devices for differential application of fertilizers taking into account heterogeneity of the thickness of the humus horizon. Modern fertilizer application technologies are based on information obtained from agrochemical soil surveys, space monitoring data and the NDVI index. At the same time, all these technologies do not take into account physical and mechanical properties of the soil which influence soil fertility and productivity. The article presents data on the relationship between soil hardness and thickness of the humus horizon which have a strong inverse correlation of the -0.7-0.85 order. Based on these data, technical devices used for differential fertilizer application were designed taking into account power of the humus horizon.
© The Authors, published by EDP Sciences, 2020
 This is an Open Access article distributed under the terms of the Creative Commons Attribution License 4.0, which permits unrestricted use, distribution, and reproduction in any medium, provided the original work is properly cited.
1 Introduction
Modern technologies of precise farming cover a wide range of agricultural operations; the main aim of these technologies is to reduce the cost of crop cultivation. One of the most promising and rapidly developing areas are precise farming technologies. These technologies cover a wide range of technological operations of crop production. Precision farming technologies are navigation systems, parallel driving systems, multi-layer electronic maps, etc [1].
All these technologies evaluate soil characteristics based on the agrochemical analysis which requires time for sampling and analysis [2, 3]. Based on the results of the analysis, task maps were created for the control systems of metering devices of fertilizer sowing machines, spreaders or sprayers.
There are technologies for on-line differential fertilizer application taking into account the state of plants by the NDVI index, which is determined by special optical sensors [4, 5]. Based on the data obtained from such sensors, the doses of fertilizers applied by spreaders or sprayers are changed directly when analyzing the state of the plants [4, 6, 7–9].
All these technologies do not take into account physical and mechanical properties of the soil which influence soil fertility.
2 Materials and methods
Based on the analysis of experimental data obtained by Samara State Agricultural Academy since the beginning of the 1990s, a strong inverse correlation between soil hardness and humus layer thickness (about -0.7-0.83) was revealed [10]. Special tools were designed and manufactured by the department of agricultural machinery and animal husbandry mechanization for measuring soil hardness during its cultivation [11].
The first machine was a dynamometric plane cutter which records soil resistivity (Fig. 1). It consists of frame 1 with a support wheel and a mounted system. Through hinge 3, the stand of the paw of plane cutter 2 is attached to the frame. To the bottom of rack 2, a working body (paw) of plane cutter 4 is fixed; between the upper end of the rack and the frame, there is a device for measuring force P acting from the soil side on the working body
When the plane cutter moves uniformly across the field at speed V, working member 4 passes through a section with a larger thickness (A2) of the humus layer, which has a less dense composition (lower bulk mass). Force P acting on working body 4 is measured by device 5. When the plane cutter moves through a section with a smaller thickness A1 which has a larger bulk mass, the impact on the working body will be larger; this will be recorded by measuring device 5. Recording equipment is connected to device 5 to record changes in the force acting on the working body of the dynamometric plane cutter. To determine soil resistance, it is necessary to divide force P at each point of the passage of the working body by the cross-sectional area (the width of the working body multiplied by the depth of its stroke) of the soil layer.
To determine soil resistance, a tractor with a dynamometric plane cutter was accelerated to the required speed and a mark was made on the GPS receiver. When moving from the starting point to the end point of the reference strip, the force acting on the legs of the plane cutter, the depth of the paws and the distance were measured using a GPS receiver. When passing through the paws of a plane cutter, a second mark was made by fixing the end of the reference strip. Thus, it was possible to record the passage of the plane cutter near the points at which samples of hardness, bulk density, and soil moisture were taken and thickness of the humus layer was determined. The results of the experiment are presented in Table 1. Points 1 ... 10 of the second accounting plot have numbers 1-10, and points 1 ... 10 of the second accounting plot have numbers 11-20.
Using the data in Table 1, the regression equation was built
where: Y – soil resistivity, kPa; G is the depth of the humus layer, mHa.
The verification showed that the linear model is adequate to experimental data.
Thus, the results suggest that in the forest-steppe zone, the dependence of soil resistance is linearly related to the thickness of the humus horizon.
However, humus heterogeneity assessment consumes much energy and reliability of the measured parameters decreases. Therefore, a sensor in the form of a flat disk was used as a measuring element. Soil resistance is directly dependent on soil hardness; therefore, hardness was used as a more universal and convenient parameter. To test the working hypothesis, theoretical studies were conducted; a disk hardness tester was designed. Unlike a plane cutter, the disc is more versatile and can be mounted on the front linkage of the tractor to determine soil hardness and thickness of the humus layer when applying fertilizers. The disk hardness tester consists of the following elements: frame 4, disk knife 1 fixed on axis 2, two-shouldered lever with an equal ratio of shoulders 3, strain gauge 5 pivotally connected to vertical stand 6 welded to frame 4. The measuring system for collecting data from the strain gauge is a block power supply, a signal amplification unit, a set of shielded cables, a battery, a digital-to-analog converter, a laptop with a USB bus. This design allows us to measure soil hardness over the entire depth of the disk. Based on the data obtained, it is possible to build maps of heterogeneity of thickness of the humus horizon and use them for differentiated fertilizer application.
The disk contacts with the soil. This feature makes it possible to exclude the influence of the friction force occurring between the mobile and non-mobile soil layers, and minimize the dependence of measurement accuracy on the speed of the unit.
To assess the performance of the device, comparative tests were carried out using a reference hardness tester (manual hardness measurement); spring wheat was sown taking into account heterogeneity of thickness of the humus layer. Before sowing, soil hardness was measured on a test plot with a hardness tester; then, in places with maximum average and minimum hardness, soil samples were taken to identify the content of nitrogen, phosphorus, potassium and humus. A task map was built for the differential application of mineral fertilizers taking into account heterogeneity and thickness of the humus horizon. In a similar area, soil analysis was performed for the control purpose; the fertilizers were applied at an average dose, based on the planned yield of spring wheat. Fertilizers were applied using an Amazone ZA-M 1500 spreader; the automatic dose adjustment of fertilizers was carried out by the Amazone Amatron Plus on-board computer. In comparison with the differential fertilizer application in the area with an average dose, the yield decreased by 17–21%.
To ensure on-line differential application of mineral fertilizers during sowing, a special system was designed. The system is universal and can easily adapt to various sowing units. It consists of a hardness tester in the form of a knife for continuous recording of soil hardness when sowing seeds (Fig. 3). The hardness gage is a mutually sharp blade mounted on a hinge stand located on the frame of the sowing unit. Through the linkage mechanism, the rack is connected to a tensile strain gauge, which registers soil hardness. The depth of the blade can be changed in a plane.
In the design under development, the metering unit is a rectangular hopper (Fig. 4), tapering at the bottom, having two outlets for fertilizers. The transmitting shaft, passing at the bottom of the hopper, is divided into two equal parts and has a screw-welded spiral coiled to the side walls of the hopper with a pitch of 25 mm; this step width allows more accurate metering of fertilizers. Visors are placed above the shaft to prevent the flow of fertilizers by gravity into the outlet openings. The upper part of the hopper serves for loading fertilizers and is closed by a lid.
The transmitting shaft is installed on one side in the bearing assembly mounted inside the hopper on its bottom, and the other side leaves the hopper. A chain sprocket is mounted on the other side of the shaft.
The bearing assembly consists of a housing, fasteners, brackets, bearing housings and bearings. On the lower side wall of the hopper, there is a servo drive mounted on the bracket, designed to transmit torque from the electric motor to the shaft of the fertilizer unit. It consists of a gear motor and chain sprocket. The chain connects the shafts of the gear motor and the shaft of the fertilizer unit. Based on the calculations, the SF 7152 motor gearbox, optimal for the design, was selected. Before starting the work, the metering units are mounted on the seeder frame using brackets, mineral fertilizers are poured, and the unit begins to move; servos are turned on, rotating the shafts of fertilizer units; fertilizers leaving the bunkers fall into the pipelines which are connected with fertilizer coulters; passing through them, fertilizers are introduced into the soil.
The electronic control circuit for dosing consists of an Arduino board, to which a GPS receiver is connected with the possibility of receiving DGPS corrections, as well as a Mega IO Expansion Shield V2.3 I / O interface board having an xBee interface, a slot for a microSD card and a platform for prototyping. The HX711 analog-to-digital converters with built-in signal amplifiers are connected to the input-output board. They allow one to read and amplify the analog signal from tensile strain gauges and convert it to the digital one. The BMD DC motor control units are also connected to the input-output board, which serve for changing the speed and direction of rotation of the gear motor shaft.
The speed and direction of rotation of the motor are controlled by changing the magnitude and polarity of the supply voltage. This change is carried out by including the motor into the bridge circuit on transistor switches controlled by the PWM method. The PWM generator is made on a microcontroller. In addition to the PWM controller, the microcontroller performs the functions of measuring the values of the control inputs, the position of the regulators, calculating speed, acceleration and braking according to the built-in program.
Due to the fact that the voltage on the tractor’s onboard network is 12 V, and the operating voltage of the gear motors is 24 V, it became necessary to install DC-DC 12–24 voltage converters. Based on the power of electric motors of the gear motors, PN12/24-15 pulse boosting converters were selected as converters, which produce a stabilized current with a maximum output longterm power of 360 W. The compact stabilized current converter PN 12/24-15 converts the incoming DC voltage of the electric transport network from 10 to 15 V into a direct current with voltage of 24 V.
For the functioning of the developed system of differential fertilizer application, special software was developed. Initially, coefficients corresponding to different values of soil hardness and the required dose of fertilizers are introduced into the program.
A knife-type hardness tester registers soil hardness at a set depth, the signal is transmitted through the Arduino amplification and conversion units where it is processed, and depending on the soil hardness, a control signal is generated to the dosing control unit, which gives the required dose of fertilizer at a given point. Soil hardness and location data are recorded using the GPS / GLONASS receiver.
After sowing, according to the data obtained, it is possible to build electronic maps reflecting soil hardness, power of the humus horizon and doses of fertilizers applied. The maps can be used as a separate layer of multi-layer electronic maps in the precision farming system.
To determine the efficiency of the designed system, field studies were carried out using the sowing unit UPS-8 “Vesta”. The sowing method is wide-row with rows of 45 cm. The sowing rate of soybean seeds is 0.8 million of germinating seeds or 96 kg. The mass of 1000 seeds is 120 g. The seeds were treated with a biological preparation Risotorfin No. 24100.
Compared to the differential fertilizer application, the average dose option showed a 12-16% decrease in the yield. Thus, the use of differentiated fertilizers during soybean cultivation in arid conditions increased the yield by 7% in the first option (30-40 cm) and by 9.2% in the second one (40-50 cm).
According to the results of these tests, it was found that accuracy of fertilizer dosing increased by 22%, soybean productivity increased by 16-22%, efficiency of fertilizer application increased by 16-19%.
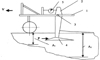 |
Fig. 1. Diagram of the dynamometric plane cutter: 1 – frame; 2 – stand paws; 3 – rack hinge; 4 – working body (paw); 5 – a device for measuring the force P; A1 – smaller thickness of the humus layer; A2 is large thickness of the humus layer. |
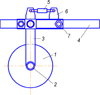 |
Fig. 2. Scheme of the disk hardness tester. |
Values of soil resistivity during the tillage by a plane cutter and thickness of the humus soil layer.
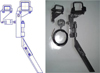 |
Fig. 3. Designed hardness tester |
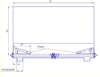 |
Fig. 4. Hopper |
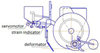 |
Fig. 5. General scheme of the differential fertilizer application during sowing. |
3 Results
Thus, the designed devices have a high efficiency when used for top-dressing with a spreader, sowing and studying physical and mechanical properties of the soil.
In case of the differential fertilizer application, the efficiency of using nutrients contained in mineral fertilizers, the yield and crop productivity increased.
Digital information about the power of the humus horizon measured by the designed devices can be used in the GIS systems as a separate layer of multilayer electronic maps; the differential fertilizer application method taking into account the depth of the humus horizon can become a separate element of precision farming technologies.
4 Conclusion
The studies on the development of technical devices for the differential application of mineral fertilizers taking into account thickness of the humus layer are highly efficient.
The developed devices make it possible to identify the heterogeneity of soil fertility and, due to the differentiated application of mineral fertilizers, will make it possible to obtain aligned seedlings, uniform growth and development of the crop according to the phenological phases, which will allow harvesting in the optimal time.
The studies revealed a strong correlation between soil hardness and thickness of the humus horizon which was confirmed by the data obtained using three hardness testers.
References
- A. McBratney et al., Future directions of precision agriculture Precision agriculture 6(1), 7–23 (2005) [CrossRef] [Google Scholar]
- D. Ehlert, K.H. Dammer, Widescale testing of the Crop-meter for site-specific farming Precision Agriculture 7(2), 101–115 (2006) [CrossRef] [Google Scholar]
- P. Feiffer et al., Hydro n-sensor in Int. Conf. on Crop Harvesting and Processing 76 (American Society of Agricultural and Biological Engineers, 2003) [Google Scholar]
- N. Zhang, M. Wang, N. Wang, Precision agriculture—a worldwide overview Computers and electronicsin agriculture 36(2), 113–132 (2002) [CrossRef] [Google Scholar]
- N.K. Binita, G.S. Dasog, P.L. Patil, Soil fertility mapping in Ghataprabha left bank canal command area of north Karnataka by geographic information system technique Karnataka J. of Agricultural Sciences 22(1) (2010) [Google Scholar]
- H.J. Di, K.C. Cameron, Nitrate leaching in temperate agroecosystems: sources, factors and mitigating strategies Nutrient cycling in agroecosystems 64(3), 237–256 (2002) [CrossRef] [Google Scholar]
- F.R. Troeh, L.M. Thompson, Soils and soil fertility (Blackwell, Ames, 2005) [Google Scholar]
- R.E. Pettit, Organic matter, humus, humate, humic acid, fulvic acid and humin: their importance in soil fertility and plant health CTI Research (2004) [Google Scholar]
- J.L. Havlin et al., Soil fertility and fertilizers (Pearson Education India, 2007) [Google Scholar]
- A.M. Petrov et al., Development of A Method For Differentiated Fertilizer Application In Conditions Of Precision Agriculture According To Soil Fertility Monitoring Research j. of pharmaceutical biological and chemical sciences 9(5), 925–934 (2018) [Google Scholar]
- V.A. Milyutkin, M.A. Kanaev, Development of technical means for monitoring the effectiveness of research in precision agriculture News of the Orenburg State Agrarian University 2(64), (2017) [Google Scholar]
All Tables
Values of soil resistivity during the tillage by a plane cutter and thickness of the humus soil layer.
All Figures
|
Fig. 1. Diagram of the dynamometric plane cutter: 1 – frame; 2 – stand paws; 3 – rack hinge; 4 – working body (paw); 5 – a device for measuring the force P; A1 – smaller thickness of the humus layer; A2 is large thickness of the humus layer. |
| In the text | |
|
Fig. 2. Scheme of the disk hardness tester. |
| In the text | |
|
Fig. 3. Designed hardness tester |
| In the text | |
|
Fig. 4. Hopper |
| In the text | |
|
Fig. 5. General scheme of the differential fertilizer application during sowing. |
| In the text | |
Current usage metrics show cumulative count of Article Views (full-text article views including HTML views, PDF and ePub downloads, according to the available data) and Abstracts Views on Vision4Press platform.
Data correspond to usage on the plateform after 2015. The current usage metrics is available 48-96 hours after online publication and is updated daily on week days.
Initial download of the metrics may take a while.