| Issue |
BIO Web Conf.
Volume 17, 2020
International Scientific-Practical Conference “Agriculture and Food Security: Technology, Innovation, Markets, Human Resources” (FIES 2019)
|
|
|---|---|---|
| Article Number | 00179 | |
| Number of page(s) | 5 | |
| DOI | https://doi.org/10.1051/bioconf/20201700179 | |
| Published online | 28 February 2020 | |
Economic efficiency of investments in producing a mixture from brewing waste for the recultivation of soil contaminated with oil and oil products
1
Samara State Technical University, 443100 Samara, Russia
2
Krasnoyarsk Milk LLC, 446370 Krasny Yar, Russia
* Corresponding author: This email address is being protected from spambots. You need JavaScript enabled to view it.
Abstract
The study of the economic efficiency of investments in the production of a mixture of brewing waste provides an opportunity to assess the possibility of its practical use for the restoration of soils contaminated with oil and oil products. The UNIDO methodology is applied to calculate the costeffectiveness of investments in the brewing waste drying line for the remediation of contaminated soils. Fulfillment of the underlying conditions for the effectiveness of investments and the absence of a negative balance in the financial plan indicate the efficiency and feasibility of investments.
© The Authors, published by EDP Sciences, 2020
 This is an Open Access article distributed under the terms of the Creative Commons Attribution License 4.0, which permits unrestricted use, distribution, and reproduction in any medium, provided the original work is properly cited.
1 Introduction
Agricultural waste, food, and processing industries, including brewing waste, contain a large number of mineral and organic compounds of different chemical nature, most of which can be used by microorganisms in the processes of growth and vital activity [1–3]. When recultivating soils contaminated with oil and products of its processing, as well as to increase the activity of indigenous microbiota, waste from various agricultural or food industries is often used [4–6].
The technology of bioremediation of oil-contaminated soils using the waste from the brewing industry has been developed. This technology has been successfully tested in the treatment of soils contaminated with oil and oil products [7]. This technology for the rehabilitation of oil-contaminated soils involves the use of dry brewing waste. Assessing the feasibility of practical application and implementation of the developed reclamation technology involves calculating the economic efficiency of investments in the brewing waste drying line.
2 Materials and methods
The cost-effectiveness of investments in a brewing waste drying line for the remediation of oil-contaminated soils was calculated using the UNIDO methodology (UNIDO – United Nations Industrial Development Organization) [8].
Evaluation of the effectiveness of investments in manufacturing equipment was based on determining the adequate income that these programs can provide.
A typical investment program provides for the payment of fixed assets at the beginning of the program and subsequent profit for many years.
The effectiveness of the investment project was assessed using the following criteria: net present value (NPV); internal rate of return (IRR); profitability ratio (BCR); return on investment (PBP).
These indicators take into account the fact of the unevenness of the same amounts of receipts relating to different periods.
Net present value (NPV), which characterizes the amount of return on investment, is determined by the formula:
 (1)
(1)
where T is the settlement period (lifetime of the investment project);
t – the specific year of the billing period;
Dt – the amount of investment income in the year t;
Kt – the amount of investment per year t;
Lt – discount coefficient is determined by the formula:
 (2)
(2)
where q is the discount rate characterizing the minimum level of profitability acceptable to the investor.
Investment Efficiency Conditions: NPV > 0, i.e., the amount of discounted investments for the entire billing period exceeds investment costs.
The formula determines the internal rate of return (IRR) – the value of the discount rate (q) at which the amounts of discounted income and expenses are equal to each other:
 (3)
(3)
Investment Efficiency Conditions: IRR > q.
The linear interpolation formula determines the exact value of the internal rate of return:
 (4)
(4)
Return on investment (BCR), i.e., the ratio of discounted income to investment expenses is determined by the formula:
 (5)
(5)
Investment Efficiency Conditions: BCR > 1.
The period of return (reimbursement) of investments (PBP), characterizing such a payback period of investments PBP = tok, at which the amount of discounted income is equal to the sum of discounted investment costs, is determined by the formula:
 (6)
(6)
The value of PBP is determined by summing up the cumulative results of cash flows until NPV = 0. The return on investment period shows how long the time-distributed income cover investment costs.
Investment Efficiency Conditions: RVR <T.
In the calculations, an interest rate of 15% was taken.
3 Results and discussion
Consider a situation in which the Committee for Ecology and Environmental Protection at the Chamber of Commerce and Industry of the Samara Region sell the mixture for the restoration of soils contaminated with oil and oil products.
The brewing waste drying line has a capacity of 0.4 t / h, which corresponds to 384 t / year.
We take into account that the need for reclamation of a contaminated area with an average oil product spill in the Samara Region is 300 t / year for all enterprises.
In this case, when selling the mixture for remediation to enterprises of the Samara region, the proceeds from its sale:
300 • 6800 = 2040000 rubles / year.
The price of the line for drying brewing waste is 4906510 rubles with a service life of 10 years.
We calculate the leading indicators of the economic efficiency of investments provided that the line is not fully loaded. For the convenience of calculation, we assume that the equipment does not operate in maximum load for 0.5 years, but in partial load (half load), but throughout the year.
According to the manufacturer, the price of the line for drying the brewing waste is 4906510 rubles.
The total estimated annual level of potential costs for the implementation of the drying process of brewing waste is 560,000 rubles / year.
The annual profit growth due to the sale of the reclamation mixture:
2040000 – 560000 = 1480000 rubles / year.
The profit growth due to the sale of the reclamation mixture amounts to 1480000 rubles/year.
Income tax is 20%.
The calculated data for evaluating the effectiveness of investments are presented in Table 1.
The calculation of the net present value:
NPV = −4906510·1 + 1674651·0.870 + 1674651·0.756 + 1674651·0.658 + 1674651·0.572 + + 1674651·0.497 + 1674651·0.432 + 674651·0.376 + 1674651·0.327 + 1674651·0.284 + 1674651·0.247 = 3498175.9 rub.
The condition for investment efficiency in terms of the net present value is observed: NPV = 498175.9 rubles > 0, i.e., the discounted benefits for the entire billing period exceed the discounted investment costs, so the project should be implemented.
The formula determines the exact value of the indicator of the internal rate of return:
 (7)
(7)
where qint.1 is the discount rate at which the net present value (NPV) assumes the positive or negative value closest to “0”;
qint.2 – the rate of discount increased (lowered) by 1 point compared with qint. in which the net present value (NPV) assumes the positive and negative value closest to “0”.
The calculation results are given in Table 2.
Based on the presented values, the graphical dependence of the net present value (NPV) on the discount rate (q) has the following form (Fig. 1).
According to the schedule, we set the q value at the intersection of the NPV chart with the q axis, %, i.e., IRR = 32%.
The efficiency condition for the indicator of the internal rate of return is met: IRR > q (by 17 (32-15) points), i.e., the indicator of the internal rate of return exceeds the minimum acceptable level of effectiveness of the proposed project for the investor by 17%.
Find the return on investment:
BCR = (1674651 • 0870 + 1674651 • 0756 + 1674651 • 0658 + 1674651 • 0572 + 1674651 • 0497 + + 1674651 • 0432 + 1674651 • 0376 + 1674651 • 0327 + + 1674651 • 0284 + 1674651 • 0247) / 4906510 = 171.
The efficiency condition for return on investment is met: BCR = 1.71 > 1 (by 1.71 points). Thus, for 1 monetary unit of investment in the project in question, an enterprise may receive 1.71 monetary units of discounted effects, or for each monetary unit of investment there is 1.71 monetary unit of the net present value of future benefits. Return on investment is high; therefore, investments in this project are profitable.
The investment recovery period (RVR) determines the length of time for which the discounted income distributed over time covers the invested costs. The analytical method consists of summing the cumulative total of cash flows to the moment when NPV = 0. As can be seen from the Table 3 discounted benefits cover the investment costs for 4 years, 2 months of the project.
The efficiency condition for the indicator of the investment recovery period is fulfilled: RVR = 4 years 2 months < T (investment period, T = 10 years).
For all indicators of assessing the effectiveness of investments over time, this project is economically profitable (Table 4).
Calculations show that the necessary conditions for the effectiveness of investments are met, and also that there is no negative balance in the financial plan. The data presented indicate the effectiveness of the proposed investment project and the feasibility of investing in this project.
Consider a situation in which the Committee for Ecology and Environmental Protection at the Chamber of Commerce and Industry of the Samara Region will not only sell the mixture for the restoration of soils contaminated with oil and oil products but also sell the remaining dry grains to agricultural enterprises for use in livestock feed.
Consider that currently in the Samara region, the potential consumption is 130,000 tons of beer grains. Of these, approximately 64% are purchased in the wet state due to the lack of appropriate equipment at the enterprises. Therefore, it needs to be dried:
130,000 • 0.46 = 59,800 tons.
Currently, Baltika-Samara LLC can produce about 12.5 thousand tons of dry grains per year. Other competing enterprises produce about 8.36 thousand tons per year of dry grains.
Thus, the current proposal for the purchase of dry grains in the Samara region is approximate:
12.5 + 8.36 = 20.86 thousand tons/year.
Therefore, demand exceeds supply by:
59800 – 20860 = 38940 t/year.
The beer pellet drying line recommended for purchase can dry an additional 384 t/year. This circumstance suggests that during the year, the Committee for Ecology and Environmental Protection at the Chamber of Commerce and Industry of the Samara Region can sell dry pellets to agricultural enterprises in full.
Consequently, at the standard market price for dry grains in the amount of 7,000 rubles/ton and with a full load of equipment in the amount of 384 tons, the annual profit of the Committee for Ecology and Environmental Protection at the Chamber of Commerce and Industry of the Samara Region will consist of the profit from the sale of the reclamation mixture soils contaminated with oil and oil products, and profits from the sale of dry grains for use in livestock feed.
Profit:
300 • 6800 + 384 • 7000 = 4728000 rubles / year
The calculated data for evaluating the effectiveness of investments are presented in Table 5.
Net present value:
NPV= −4906510·1 + 4273051·0.870 +14273051·0.756 + 4273051·0.658 + 4273051·0.572 + 4273051·0.497 + 4273051·0.432 + 4273051·0.376 + + 4273051·0.327 + 4273051·0.284 +4273051·0.247 = 16538944.3 rub.
The condition for investment efficiency in terms of net present value is observed: NPV = 16538944.3 rubles > 0. Thus, the discounted benefits for the entire billing period exceed the discounted investment costs, so the project should be implemented.
The calculation results are given in Table. 6.
Based on the presented values, the graphical dependence of the net present value (NPV) on the discount rate (q) is as follows (Fig. 2).
According to the schedule, we set the q value at the intersection of the NPV chart with the q axis, %, i.e., IRR = 87%.
The efficiency condition for the internal rate of return indicator is met: IRR many> q (by 72 (87-15) points). That is, the indicator of the internal rate of return exceeds the minimum acceptable level of effectiveness of the proposed project for the investor by 72%.
ROI
BCR = (4273051 • 0870 + 14273051 • 0756 + 4273051 • 0658 + 4273051 • 0572 + 4273051 • 0497 + 4273051 • 0432 + 4273051 • 0376 + 4273051 • 0327 + (4273051 • 0284 + 4273051 • 0247) / 4906510 = 437
The efficiency condition for return on investment is met: BCR = 4.37> 1 (by 4.37 points). That is, for 1 monetary unit of investment in the project in question, an enterprise may receive 4.37 monetary units of discounted effects, or 4.37 monetary units of the net present value of future benefits are required for each monetary unit of investment. Return on investment is high; therefore, investments in this project are profitable.
The investment recovery period (RVR) determines the length of time for which the discounted income distributed over time covers the invested costs. The analytical method consists of summing the cumulative total of cash flows to the moment when NPV = 0. As can be seen from the Table 7, discounted benefits cover the investment costs for 1 year 7 months of the project.
The efficiency condition for the indicator of the investment recovery period is fulfilled because of RVR = 1 year 7 months < T (investment period, T = 10 years).
For all indicators of assessing the effectiveness of investments over time, this project is economically profitable (Table 8).
The calculations showed that the necessary conditions for the effectiveness of investments are met, and that there is no negative balance in the financial plan. This fact indicates the effectiveness of the proposed investment project and the feasibility of investing in this project.
Estimated data for evaluating the effectiveness of investments in a line for drying brewing waste in the production of only reclamation mixtures
The dependence of NPV on q in the production of only reclamation mixtures.
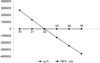 |
Fig. 1. Graphical dependence of NPV on q in the production of only reclamation mixtures |
Summing the cumulative total cash flows in the production of only mixtures for reclamation.
Indicators of economic efficiency of investments in the production of only mixtures for reclamation.
Estimated data for evaluating the effectiveness of investments in the line for drying brewing waste in the production of a mixture for the reclamation and sale of surplus dry beer grains to agricultural producers.
Dependence of NPV on q in the production of a mixture for the reclamation and sale of surplus dry beer grains to agricultural producers
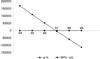 |
Fig. 2. The graphical dependence of NPV on q in the production of a mixture for the reclamation and sale of surplus dry beer grains to agricultural producers. |
Summation of the cumulative total cash flows in the production of the mixture for the reclamation and sale of surplus dry beer grains to agricultural producers.
Indicators of economic efficiency of investments in the production of a mixture for the reclamation and sale of surplus dry beer grains to agricultural producers.
4 Conclusion
The investment project is valid, which indicates that investments in these projects are appropriate for the Committee for Ecology and Environmental Protection at the Chamber of Commerce and Industry of the Samara Region. The Committee for Ecology and Environmental Protection at the Chamber of Commerce and Industry of the Samara Region can, through this project, realize a mixture for the restoration of soils contaminated with oil and oil products, but also sell the remaining dry grains to agricultural enterprises for use in livestock feed. Implementation of the proposed investment projects allows, firstly, to profit from the investments made, secondly, to solve the problem of recycling brewing waste, and thirdly, to obtain a mixture for the restoration of soils contaminated with oil and oil products, fourthly, to increase the efficiency of the restoration process oil-contaminated soils and, fifthly, improve the environmental situation in the Samara region and other regions of the Russian Federation.
References
- P. Nigam, D. Sing, A. Pandey, Agro Food Ind. HiTech/AG Biotech. E., 12, 3 (2003) [Google Scholar]
- S.I. Mussatto, G. Dragone, C.I. Roberto, J. Cereal Sci. E., 43 (2006) [Google Scholar]
- W. Russ, Utilization of By-Products and Treatment of Waste in the Food Industry (Springer Science+Business Media, LLC, New York, 2007) [Google Scholar]
- M. Schaefer, J. Filser, Appl. Soil Ecol. E., 36 (2007) [Google Scholar]
- W. Namkoong, E.-Y. Hwang, J.-S. Park, J.-Y. Choi, Environ. Pollut. E., 119 (2002) [Google Scholar]
- K. Van Gestel, J. Mergaert, J. Swings, J. Coosemans, J. Ryckeboer, Environ. Pollut. E., 125 (2003) [Google Scholar]
- E.Yu. Rudenko, Ecology and Industry of Russia, 10 (2012) [Google Scholar]
- W. Behrens, P.M. Hawranek, Manual for the Preparation of Industrial Feasibilty Studies (UNIDO, Vienna, 1991) [Google Scholar]
All Tables
Estimated data for evaluating the effectiveness of investments in a line for drying brewing waste in the production of only reclamation mixtures
Summing the cumulative total cash flows in the production of only mixtures for reclamation.
Indicators of economic efficiency of investments in the production of only mixtures for reclamation.
Estimated data for evaluating the effectiveness of investments in the line for drying brewing waste in the production of a mixture for the reclamation and sale of surplus dry beer grains to agricultural producers.
Dependence of NPV on q in the production of a mixture for the reclamation and sale of surplus dry beer grains to agricultural producers
Summation of the cumulative total cash flows in the production of the mixture for the reclamation and sale of surplus dry beer grains to agricultural producers.
Indicators of economic efficiency of investments in the production of a mixture for the reclamation and sale of surplus dry beer grains to agricultural producers.
All Figures
|
Fig. 1. Graphical dependence of NPV on q in the production of only reclamation mixtures |
| In the text | |
|
Fig. 2. The graphical dependence of NPV on q in the production of a mixture for the reclamation and sale of surplus dry beer grains to agricultural producers. |
| In the text | |
Current usage metrics show cumulative count of Article Views (full-text article views including HTML views, PDF and ePub downloads, according to the available data) and Abstracts Views on Vision4Press platform.
Data correspond to usage on the plateform after 2015. The current usage metrics is available 48-96 hours after online publication and is updated daily on week days.
Initial download of the metrics may take a while.