| Issue |
BIO Web Conf.
Volume 31, 2021
VI International Scientific Conference “Problems of Industrial Botany of Industrially Developed Regions” 2021
|
|
|---|---|---|
| Article Number | 00016 | |
| Number of page(s) | 4 | |
| DOI | https://doi.org/10.1051/bioconf/20213100016 | |
| Published online | 13 August 2021 | |
Strip clay application accelerates for 15–20 years the vegetation formation in ash dump (Middle Urals, Russia)
1 Laboratory of Anthropogenic Dynamics of Ecosystems, Institute of Natural Sciences and Mathematics, Ural Federal University named after the first President of Russia B. Yeltsin, 19 Mira Str., 620002, Ekaterinburg, Russia
2 Department of Earth and Space Sciences, Institute of Natural Sciences and Mathematics, Ural Federal University named after the first President of Russia B. Yeltsin, 19 Mira Str., 620002, Ekaterinburg, Russia
3 Institute of Plant and Animal Ecology, Ural Division, Russian Academy of Plant and Animal Ecology, Ural Division, Russian Academy of Sciences, 202 March 8 Str., 620144, Ekaterinburg, Russia
* Corresponding author: This email address is being protected from spambots. You need JavaScript enabled to view it.
Abstract
As a result of a generalization of 45-year monitoring observations at on the ash dump of the Verkhniy Tagil Power Station, the absolute time scale was made, stabilization rates during succession of different plant communities characteristics were assessed in two areas: recultivated and non-recultivated. Recultivation consisted of clay strips applying (5–8 m wide, 10–15 cm thick) on ash surface. All characteristics of plant communities (total projective cover by plants, total number of species in plant community) are formed 15–20 years faster in recultivated area. So, a simple technical recultivation, (clay strips applying), significantly accelerates the formation of plant communities main characteristics on ash surface in subzone of the southern taiga in Middle Urals.
© The Authors, published by EDP Sciences, 2021
 This is an Open Access article distributed under the terms of the Creative Commons Attribution License 4.0, which permits unrestricted use, distribution, and reproduction in any medium, provided the original work is properly cited.
1 Introduction
Ural is an old industrial region of Russia, where mining lasts on large areas for over 100 years. Mining of minerals is accompanied by significant changes in surrounding landscape: disturbances in vegetation and soil cover.
One of the forms of anthropogenic disturbance of landscape is ash dumps of thermal power plants. Occupying large territories, they are constant sources of air and soil pollution. Restoration of vegetation on such substrates is extremely slow [1, 2]. To speed up this process, recultivation work is necessary. Main factors limiting the growth and development of plants at first stages of vegetation formation on ash dumps are wind erosion, low moisture capacity, poor thermal conductivity, and complete absence of organic matter [3–5]. One of common ways to recultivate ash dumps is to cover their surface with a layer of soil, which stops ash dusting, and is also a source of nutrients for plants [6–8]. Due to the fact that Middle Urals is a densely populated mountain-plain region, territory of which is largely covered by forests, there is very little amount of free land for reclamation work near industrial enterprises. Laboratory of Industrial Botany of the Ural Federal University has developed an economical method of recultivation – applying soil strips to the surface of ash dump. This method was tested at ash dump of Verkhniy Tagil Power Station.
The aim of study was the impact of recultivation activities consequences on the rate of plant communities formation. We were interested in how the time to achieve certain characteristics of plant communities depends on simple technical recultivation performed.
2 Material and methods
Areas and sites. Ash dump of Verkhniy Tagil Power Station (VTPS) is located in Middle Urals in Sverdlovsk Region, 5 km from Verkhny Tagil (taiga zone, subzone of southern taiga). Area of ash dump is 125 ha, height of dams is from 0 to 25 m. According to particle size distribution, the ash is represented by fractions of sand and dust mixed with crushed slag. Ash from VTPS ash dump is extremely poor in nitrogen has a high content of mobile phosphates and has a low content of potassium pH of the ash sample is weakly alkaline [9, 10].
Recultivation at VTPS ash dump began in 1968–1970 and continued in subsequent years. Clay and soil mix taken from a nearby quarry was applied to the dried part of ash dump. Clay was applied in strips of 5–8 m wide, thickness of applied layer was 15–20 cm. Coated strips were alternated with ash strips of the same size and were perpendicular to prevailing wind direction.
Monitoring studies of vegetation formed in process of self-growth were carried out in recultivated and non-recultivated areas of ash dump. Results of geobotanical observations in both areas, conducted from 1968 to 2018, were analyzed. The first 4 years, the research was carried out annually, since 1975 – after 5–10 years. All descriptions were performed using the same methods. The following characteristics were used: general projective cover by vegetation (GPC, %), total floristic wealth is number of species in community as a whole [11].
To assess the conversion rates of characteristics, we performed a search of adequate approximations of empirical points. We used non-asymptotic (straight line and logarithmic) and asymptotic (logistic, decaying exponential, exponential) functions. Results of asymptotic and non-asymptotic approximations was used to determine whether characteristic value stabilizes or not during the observation period. With adequacy of asymptotic approximations, parameter stabilization time was calculated, being guided by a threshold of 90–95% of assumed stationary level of characteristic. If the results of our studies showed that during observation period stabilization of considered communities characteristics did not occur, the rate of formation of characteristics was estimated by the time they reached randomly selected values.
3 Results and discussion
Studies have shown that in the recultivated areas of the VTPS ash dump, the formation of vegetation proceeded rapidly from the weeds stage to forest phytocenoses dominated by Betula pendula Roth, Pinus sylvestris L., Populus tremula L. and Picea obovata Ledeb.
Non-recultivated sites were firstly colonized by the short-term pioneer group of halophyte species (Puccinellia distans (Jacq.) Parl. and Puccinellia hauptiana (V.I. Krecz.) Kitag., which was replaced by a shrub group and later on, natural colonization by trees has started [9].
Analysis of geobotanical characteristics of studied plant communities showed that GPC by vegetation during the observation period stabilized s both in recultivated and non-recultivated areas (Fig. 1). However, in recultivated area, stabilization of total coverage was achieved during the first 10 years of succession, and in non-recultivated area, closer to 20 years.
Total number of species detected in recultivated area was growing rapidly in first years of succession. This was due primarily to the fact that strip application of soil created more favorable conditions for growth and settlement of plants, in addition, soil contains a seed bank. After 10 years of research number of species was stabilized fluctuating in the range of 70–90 species (Fig. 2a). In non-recultivated area of ash dump, the total number of species was not stabilized but it continued to grow. By 37–45 years of overgrowing, total species diversity was no more than 70 species (Fig. 2b).
Thus, a comparison of overgrowing speed of recultivated and non-recultivated sites of VTPS ash dump showed that all compared characteristics of plant communities (total projective cover by plants, total number of species in plant communities was formed in recultivated area 15–20 years faster. General succession changes in composition of communities were expressed in a decrease of participation of ruderal species and an increase in the proportion of perennial forest species.
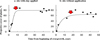 |
Fig. 1 Total projective vegetation cover during overgrowth of recultivated (a) and non-recultivated (b) areas at ash dump of Verkhniy Tagil Power Station. Approximations by function of decaying exponent (a) and logarithmic function (b). Arrows indicate the moments when values of characteristics of communities are reached, which are discussed in text as qualitative indicators. |
4 Conclusion
General course of successions in recultivated and non-recultivated sites of VTPS ash dump was logical: during the formation of plant communities, species richness and floral richness of communities grew total projective cover by vegetation. All compared characteristics of plant communities reached the selected marks 15–20 years earlier in recultivated area. Thus, technical recultivation, which is clay strips applying, accelerated (for 15–20 years) the formation of main characteristics of plant communities on surface of ash dump in subzone of southern taiga in Middle Urals.
The work was carried out with financial support of Ministry of Science and Higher education of the Russian Federation as part of state task of the Ural Federal University FEUZ-2020-0057; RFBR grant N 18-04-00714; RFBR – Government of the Sverdlovsk region, grant No 20-44-660011.
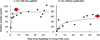 |
Fig. 2 Floristic richness - number of species in community as a whole – during overgrowing of recultivated (a) and unrecultivated (b) sites in ash dump of Verkhny Tagil Power Station. Approximations by function of decaying exponent (a) and logarithmic function (b). Arrows indicate the moments when values of characteristics of communities are reached, which are discussed in text as qualitative indicators. |
References
- B. Mustafa, A. Hajdari, F. Krasniqi, I. Morina, F. Riesbeck and A. Sokoli, Research J. Environ. Earth Sci. 4, 823–834 (2012) [Google Scholar]
- V. C. Pandey, P. Prakash, O. Bajpai, A. Kumar, N. Sing, Environ. Sci. Pollut. Res. 22(4), 2776–2787 (2015) [Google Scholar]
- S. Jala, D. Goyal, Bioresour. Technol. 97, 1136–1147 (2006) [Google Scholar]
- R. J. Haynes, J. Environ. Manage. 90, 43–53 (2009) [Google Scholar]
- M. Ahmaruzzaman, Prog. Energy Combust. Sci. 36, 327–363 (2010) [Google Scholar]
- D. C. Adriano and J. T. Weber, J. of Environmental Quality 30, 596–601 (2001) [Google Scholar]
- K. C. Cheung, J. P. K. Wong, Z. Q. Zhang, J. W. C. Wong and M. H. Wong, Environ. Pollut. 109, 75–82 (2000) [Google Scholar]
- J. Shen, X. Zhou, D. Sun, J. Fang, Z. Liu and Z. Li, Environ. Geol. 53, 1777–1785 (2008) [Google Scholar]
- T. S. Chibrik, N. V. Lukina, E. I. Filimonova, M. A. Glazyrina, E. A. Rakov, M. G. Maleva and M. N. V. Prasad, Bioremediation and Bioeconomy (Elsevier, Amsterdam, 2016) [Google Scholar]
- M. Maleva, G. Borisova, N. Chukina, O. Sinenko, E. Filimonova, N. Lukina and M. Glazyrina. Horticulturae. 7(109), (2021) [Google Scholar]
- B. M. Mirkin, L. G. Naumova, A. I. Solomeshch, Modern vegetation science (Logos, Moscow, 2000) [Google Scholar]
All Figures
|
Fig. 1 Total projective vegetation cover during overgrowth of recultivated (a) and non-recultivated (b) areas at ash dump of Verkhniy Tagil Power Station. Approximations by function of decaying exponent (a) and logarithmic function (b). Arrows indicate the moments when values of characteristics of communities are reached, which are discussed in text as qualitative indicators. |
| In the text | |
|
Fig. 2 Floristic richness - number of species in community as a whole – during overgrowing of recultivated (a) and unrecultivated (b) sites in ash dump of Verkhny Tagil Power Station. Approximations by function of decaying exponent (a) and logarithmic function (b). Arrows indicate the moments when values of characteristics of communities are reached, which are discussed in text as qualitative indicators. |
| In the text | |
Current usage metrics show cumulative count of Article Views (full-text article views including HTML views, PDF and ePub downloads, according to the available data) and Abstracts Views on Vision4Press platform.
Data correspond to usage on the plateform after 2015. The current usage metrics is available 48-96 hours after online publication and is updated daily on week days.
Initial download of the metrics may take a while.