| Issue |
BIO Web Conf.
Volume 33, 2021
The 1st International Conference of Advanced Veterinary Science and Technologies for Sustainable Development (ICAVESS 2021)
|
|
|---|---|---|
| Article Number | 01002 | |
| Number of page(s) | 10 | |
| Section | Biodiversity and Wildlife Conservation | |
| DOI | https://doi.org/10.1051/bioconf/20213301002 | |
| Published online | 23 August 2021 | |
Diversity and Distribution of Molluscs in the Intertidal Zone of Nglambor Beach, Gunung Kidul, Yogyakarta
Department of Biology Education, Faculty of Mathematics and Natural Sciences, Universitas Negeri Yogyakarta. Jl. Colombo No. 1 Karang Malang, Yogyakarta. Tel.: +62 -586168
* Correspondence author: This email address is being protected from spambots. You need JavaScript enabled to view it.
Abstract
The intertidal zone is the area between the highest and lowest tides, which represents the transition from ocean conditions to land conditions. This study aimed to determine the diversity and distribution of mollusks that exist along the intertidal zone of Nglambor Beach, between August and November 2020. Observations of all molluscs were carried out at two random stations using 10 plots measuring 1 x 1 m 2 with 5 meters. A total of two classes of Mollusca (Gastropod and Bivalvia) belonging to twelve families and 19 species were found from upper to lower an intertidal zone. The upper intertidal zone was recorded to have the highest diversity and an evenness index (Shannon-Wiener diversity index: H ’= 2.524 and Pielou evenness index: J’ = 0.932) compared to the middle and lower zones. It can be concluding that the diversity index in the study location is categorized as medium and its evenness is high. Thais hippocastanum is the most dominant species found in the upper and middle zones, while Thais tissoti dominates in the lower zone. This research contributed to a preliminary checklist on molluscs, which will support a baseline study on the intertidal in future.
Key words: Intertidal Zone / Molluscs / Diversity / Evenness / Nglambor Beach
© The Authors, published by EDP Sciences, 2021
 This is an Open Access article distributed under the terms of the Creative Commons Attribution License 4.0, which permits unrestricted use, distribution, and reproduction in any medium, provided the original work is properly cited.
1 Introduction
The intertidal region, a zone of interaction between sea, land, and atmosphere, is one of the most interesting divisions of marine ecosystem, as it is daily covered and uncovered by flooding and ebbing tides. Organisms found on rocky shores are facing intense physicochemical conditions during tidal changes from upper to lower intertidal zones. This includes regular exposure to air during low tide as well as differences in environmental parameters such as temperature, salinity, pH, and oxygen that occur perpendicular to the shore [1, 2, 3]. Despite these challenges, resilient and resistant organisms such as algae, lichens, barnacles, and molluscs are commonly found in such environments [4, 5].
Nglambor Beach is one of the rocky beaches in the south of Gunungkidul Yogyakarta. This beach is in Purwodadi Village, Tepus district. The main character of this beach is that it has a basic material in the form of sandy coral with sand that is more dominant than the type of coral. Additionally, there is a kind of karst rock (limestone) that adorns the underwater. The physical condition of this beach has steep cliffs, karst hills and white sand. Nglambor beach has waves that are not too high due to the giant hill that looks like a turtle as a breakwater.
The intertidal zone on the Nglambor beach is divided into three subzones which are regulated by different biological and physical factors, namely the upper, middle, and lower zones [6]. During the highest, all three sub intertidal zones are submerged, and the tidal zone is only seen during the lowest tide [7]. Some substrate types in the intertidal area on Nglambor beach are sandy and some are rocky. Organisms found on rocky shores face intense physicochemical conditions during tidal changes from upper to lower intertidal zones, such as temperature, salinity, pH, and oxygen which occur perpendicular to the coast [2, 3, 8].
Molluscs are one of many organisms found on this beach, animals that can bury themselves and tend to have slippery and heavy shells. Molluscs are the second largest phylum after Arthropods (insects) with an estimated 80,000-100,000 species identified [9, 10]. These animals have soft bodied features, which are housed by a single, calcareous shell that varies in size, shape, and colour. Molluscs have important roles in coastal ecosystem food webs, algae feeders, detritivores, and deposit feeders [1, 2, 3].
Abundance and intertidal biota were reported from the south coast of Gunungkidul by [11 - 16]. The processes in an ecosystem can take on the diversity of the organisms that make it up. Measuring species richness and diversity across different habitats are a useful tool for planning actions to conserve marine biodiversity [8, 17, 19, 20]. Therefore, this study explains the species composition, diversity and evenness of molluscs and compares them in three, intertidal zones, upper, middle, and lower. The results of this study are expected to enrich the data on the species and habitat of invertebrates in Yogyakarta, Indonesia. The study aims to determine the diversity and distribution of molluscs that exist along the intertidal zone.
2 Materials and Methods
2.1 Study sites
The sampling was carried out in August 2020 and November 2020 at the low tide. The intertidal area was divided into three zones: upper, middle and lower intertidal beaches. The research was located at 8°10’55"S and 110°40’44ʺE. Nglambor beach located in Tepus, Gunungkidul Regency, Indonesia. Abiotic data sampling was done by measuring physical and chemical factors including substrate, temperature, pH, and salinity.
2.2 Procedures
2.2.1 Sample collections
This study used a systematic plot transect method by placing a 1x1 m2 plot systematically along the transect. The implementation technique was to determine the main axis (SU) parallel to the coastline with a distance between the main axis and the coastline was 10 meters. Then 2 stations observation randomly had to be determined, afterwards the plots with 5 m each we relayed. In each plot, observations were made of all molluscs, including those at the bottom of the substrate. For animals embedded in the substrate, a dig to a depth of 5-10 cm was performed.
Collecting data for molluscs were carried out directly at the research location, namely recording species, morphological characteristics some species in each plot, after collecting photos, photos of the specimens were collected. Finally, the sample was placed into a plastic jar that already contains 70% alcohol soaked until all parts of the body of the sample were immersed.
2.2.2 Colour illustrations
The molluscs were brush cleaned and washed with tap water to remove layers of algae, another crust, and dirt. The identification of molluscs based on morphological characteristics in the form of shape, colour, and shell characteristics. Molluscs are identified to the lowest possible taxonomic level using key taxonomic identifications [16, 21-27]. The validity of species names was also reviewed from the World Register of Marine Species (WoRMS) a database.
2.3 Data Analysis
The density of marine gastropods was determined as a few individuals/m2. The diversity was calculated using the Shannon-Wiener index.
Shannon-Wiener index formula is:
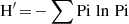
In the above, H’ is the value of the Shannon-Wiener diversity index, Pi is the proportion of the ith species (ni/N), ni is the number of individuals of the ith species, N = the total number of individuals of all types. The Shannon-Wiener diversity index is classified into three levels: low (H’<2); moderate (2<H’<4); and high (H’>4) [28].
The species evenness index was calculated using Pielou’s evenness index.
Pielou’s evenness index formula is:
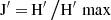
In the above equation, H’ is the Shannon-Wiener diversity index and H’ max is the natural logarithm of species richness. Species evenness ranges from zero to one, with zero signifyings no evenness, and one a complete evenness.
Frequency of incidence (FoI) was estimated using the below equation.
Frequency of incidence formula is:
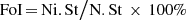
In the above equation, Ni.St is the total number of locations where the species I was found and N.St is the total number of sampling locations [29].
3 Result
A total of two class of molluscs (Gastropod and Bivalvia), belonging to thirteen families and 20 species, were found in upper to lower intertidal zone at Nglambor Beach (Table 1 and Figure 1).
In this study 15 Gastropod and 4 Bivalvia species were revealed. The Molluscs species referred to in Table 1. Thais hippocastanum (Muricidae) was the most abundant species in the upper and lower intertidal zones, while T. tissoti (Muricidae) was the most abundant in the middle zone. More commonly known as a murex or rock snails, Muricidae are reported to be widely distributed inhabiting coastal and marine habitats [30-33]. Most of the Muricidae are seen clustered between rock crevices. This behaviour is to ensure water and a humidity conservation during the dry season at a low tide. This can prevent damage to marine gastropoda systems, such as respiration, excretion, and digestion [34]. Such characteristics help the Muricidae to be resilient in extreme ecosystems.
In general, higher Fol gastropods were found mostly at all sampling locations, compared to the number of Bivalves (Table 1). Based on the sampling station, it was found that station II had the highest species richness compared to Station I. Station II was the location that received a direct sea water flow. The flow of sea water was observed from west to east and periodically reverses a direction. The water flow that occurs causes the water in the area to come directly from ocean currents, so there are far more species inhabiting the area in contrast to station I.
The species that have the lowest abundance in the upper intertidal zone were Conus biliosus (Conidae), in the middle zone Aplysia dactylomela (Aplysiidae) and Monetaria annulus (Cypraeidae). In the lower zone it was Thais distinguenda (Muricidae) (Figure 1). We expect that some of these species have a difficulty adapting to extreme environmental conditions, such as the disturbance by physical and biological parameters as well as to predation, competition, the light intensity, and hydrodynamics.
The index of Shannon-Wiener diversity for molluscs ranged from 1.925 - 2.524, where the highest diversity is in the upper zone and low diversity was in the lower zone. In general, the average diversity of molluscs was 2.254 which indicates a moderate category. The evenness index of the species ranged from 0.876 - 0.932 with an average value of 0.895 and showed high evenness (Table 2). The number of individuals affects the evenness because these species can be found in large numbers at each station. T. hippocastanum, T. tissoti and Conus coronatus were the predominant species found in the high abundance upper, middle, and lower zones. The diversity index in the moderate category shows a good balance between the number of species, and the total individuals of each species. Meanwhile, the high evenness index of molluscs found in the research location indicates that the distribution of individuals in each species is evenly distributed in a community and no species dominated.
In general, molluscs are detritus feeders, they grow well in substrates with high organic matter. According to [35] the abundance of molluscs depends on the availability of foods, such as detritus and macro algae, and they prefer habitats that are protected from currents, waves, and direct sunlight [34, 36, 37]. In addition, the abundance of molluscs at the research location was supported when data collection was carried out during the rainy season, where the input of organic matter increased, and the area of organic bodies increased, and the area of water bodies increased, among others by the formation of flood plains, so most of the members reproduced. This research contributed to enhanced knowledge in marine biodiversity. The benefit of this knowledge is contributes to a preliminary checklist on molluscs, which will support a baseline study on the intertidal in future.
Based on ecological parameters (Table 3), station 1 which is on the west side has the highest PH. Environmental bases that appear at station 1 are rock cliffs formed from coral. Rocks that contain calcium carbonate (CaCO3) can increase the pH of the water in the area by more than 7. Station 4 is a location that gets direct seawater flow. Seawater flow is observed from west to east periodically reverses direction. The water that occurs causes the water in the area to come directly from the ocean currents. The water temperatures at each research location has variations. Temperature variations at each research station are closely related to sunlight. At station 1 some cliffs can interfere with sunlight reaching the water maximally compared to other research stations so that the temperature is lower.
Diversity of Molluscs in Nglambor Beach.
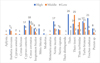 |
Fig. 1. Total number of individuals of molluscs in each zone |
Shannon-Wiener Diversity Index (H ’) and Species Evenness Index (J’).
Ecological Parameters in Nglambor Beach.
4 Discussion
This research found 15 species from the class Gastropods and 4 species from the class Bivalvia in the upper, middle, and lower intertidal zones. In the class Gastropods, the following species were found: Aplysia dactylomela, Conus biliosus, Conus coronatus, Cypraea annulus, Cypraea carneola, Monetaria annulus, Mitra litterata, Thais distinguenda, Thais hippocastanum, Thais tissoti, Thais turbinidae, Nerita incerta, Nerita signatus, Trochus radiatus dan Turbo bruneus. Meanwhile, in the Bivalvia class, Barbatia reeveana, Isonogmon bicolor, Modiolus philippinarum, and Pecten sp. Thais hippocastanum (Muricidae) is the most dominant species found in the upper and middle zones, while Thais tissoti (Muricidae) dominates in the lower zone. Muricidae were found in all zones with high diversity. This may be related to shell morphology and sculptural patterns [38, 39]. Muricidae such as Thais hippocastanum and Thais tissoti have slender shells and high spires which can help them minimize the effects of strong waves during high tide and water loss during high tides low tide. While the species found in small numbers were Conus biliosus in high tide, Aplysia dactylomela, and Monetaria annulus in middle tide, and Pecten sp. in low tide. This is related to the availability of food sources and supportive environmental conditions. Bivalvia generally prefer substrate muddy, sandy, or a mixture of both [40].
The identified mollusc species, especially the Gastropod group, exhibit unique behaviour. They can move fast enough to hide into rock or rock holes to protect themselves from strong waves at high tide, while at low tide the animals come out of hiding to find food. This dynamic behaviour becomes a routine activity to maintain its survival and adapt to natural conditions or the environment. In addition, several types of molluscs were found in a dead state, which was only in the form of shells scattered along the coast. Mollusc’s species are affected by movement patterns and levels of exposure to wave action and the difference in their density on the Nglambor beach may be due to adaptation to water parameters and biological factors such as food distribution in the area [41].
The diversity index can show the balance of the aquatic environment which is characterized by the emergence of certain species that are more dominant over other species in the community so that in an unbalanced aquatic environment, the diversity index will be low, especially if there are only one species that dominates and has the percentage of the number exceeds 50% of the total species that exist [42].
The upper intertidal zone was recorded to have the highest diversity and an evenness index (Shannon-Wiener a diversity index: H ’= 2.524 and Pielou evenness index: J’ = 0.932) compared to the middle and lower zones. It can be concluded that the diversity index in the study location is categorized as moderate and its evenness is high. A community is said to have high diversity if there is no competition between species, there is sufficient food availability, and supportive environmental conditions. [42] Soegianto (1994) states that a community is said to have high species diversity if the community is composed of many species (species) with the same or almost the same species abundance. The same thing was stated by [43] Odum (1996) that species that have high species diversity shows that these species can occupy a wider space so that there are more opportunities to breed.
In addition, environmental factors such as the level of exposure to wave action, duration of exposure and immersion by seawater, and sea temperature may affect the value of mollusc’s diversity in the study area [41]. The presence or absence of competitors, predators, and food sources is also expected to affect species diversity in the area. All specimens found in the transect plot were identified, counted, and recorded in the field, except for unidentified specimens, collected, put in a plastic jar containing 70% alcohol, and brought to the Zoological Laboratory of Yogyakarta State University for further identification. Gastropods and bivalves were identified for the key following species level by [21-27, 29]. Valid gastropod and Bivalvia names are referred to the World Register of Marine Species (WoRMS). Density is determined as some individuals/m2. Shannon Wiener and Pielou’s indices were used to analyse the species diversity and evenness of their respective animal communities [44].
This study is the first attempt at surveying molluscs on the intertidal rocky coast of Nglambor Beach. Although it is preliminary, it could provide a baseline study on the occurrence and distribution of molluscs in this area. This study contributes to a complete checklist on molluscs of the south coast of Yogyakarta.
5 Conclusion
A total of two classes of molluscs (Gastropoda and Bivalvia) belonging to 12 families and 19 species were found from upper to lower an intertidal zone. The upper intertidal zone was recorded to have the highest diversity and an evenness index (Shannon-Wiener a diversity index: H’= 2.524 and Pielou evenness index: J’= 0.932) compared to the middle and lower zones. It can be concluded that the diversity index in the study location is categorized as moderate and its evenness is high. Thais hippocastanum (Muricidae) is the most dominant species found in the upper and middle zones, while T. tissoti (Muricidae) dominates in the lower zone.
This study is the first attempt of surveying molluscs on the intertidal rocky coast of Nglambor Beach. Although it is preliminary, it could provide a baseline study on the occurrence and distribution of molluscs in this area. This study contributes to a complete checklist on molluscs of the south coast of Yogyakarta.
This research was carried out with the support of DIPA FMIPA UNY in 2020. For this reason, the research team would like to thank you the Dean of FMIPA UNY and his staff for the opportunities, and funds provided.
References
- Marshall D. J., Baharuddin N., McQuaid C. D., Marine Biology 160, 9 (2013) [Google Scholar]
- Smith D., Ecology of the New Zealand Rocky Shore Community: A Resource forNCEA Level 2 Biology, (2013) [Google Scholar]
- Chappuis E., Terradas M., Cefali M. E., Ballesteros E, Estuarine, Coastal and Shelf Science 147:113-122, (2014) [Google Scholar]
- Moyse J., Smith N. A. Zonation of animals and plants on rocky shore around Dale, Pembrokeshire. Field Studies 1(5): 1-31, (1963) [Google Scholar]
- Coughlan J., Crowe T., Rocky shore survey. School of Biology and Environmental Science, University College Dublin (2009) [Google Scholar]
- Ellis D. V. Rocky shore intertidal zonation as a means of monitoring and assessing shoreline biodiversity recovery. Marine Pollution Bulletin 46: 305-307, (2003) [CrossRef] [PubMed] [Google Scholar]
- Molles M. C. J. 2016. Ecology: concepts and applications 7th edition. McGraw Hill Education. [Google Scholar]
- Magurran, AE. 1988. Ecological Diversity and Its Measurement. Croom Helm, London. [CrossRef] [Google Scholar]
- Strong E. E., Gargominy O., Winston F. P., Bouchet P., Hydrobiologia, 595, (2008) [Google Scholar]
- Pechenik J. A. Biology of the invertebrates 7th edition. McGraw-Hill Education, (2016) [Google Scholar]
- Nuraeni and D.S. Yudha. Diversity of Ophiuroids in Intertidal Zone of Porokand Kukup Beach Gunung Kidul Yogyakarta, in Proceeding The 5th International Conference on Global Resources Conservation (ICGRC). ISSN 2302-108X, 5, (2014) [Google Scholar]
- Budiantoro, A. and Persada, A.F. The Gastropod Diversity in Intertidal Zoneat Sundak Beach District Gunungkidul, in Proceeding The 2nd International Conference on Green World in Business and Technology. Ahmad Dahlan University, 23 Maret 2013, (2015) [Google Scholar]
- Sukiya and R.A. Putri. Jurnal Sains Dasar, 4(2): 107-115 (2015) [Google Scholar]
- A. Triatmojo, R. Ario, and W. Widianingsih, Journal of Marine Research, 7, 4 (2018) [Google Scholar]
- Sukmaningrum, B.K. Adji., E.M. Pratiwi, B. Larasati, P.R. Sayekti, I. Maulana, R. Epilurahman. Inventing Prosperous Future Biological Research and Tropical Biodiversity Management. AIP Cobf. Proc. 2002, 020066-1-020066-6, (2018) [Google Scholar]
- Y.F. Rahmawati. Jurnal Biota, 7(1): 36-41 (2021) [Google Scholar]
- Pielou, E.C. Ecological diversity (John Wiley & Sons, New York, 1975) [Google Scholar]
- Magurran, AE. Ecological Diversity and Its Measurement (Croom Helm, London, 1988) [CrossRef] [Google Scholar]
- Gray, J.S., Biodivers. Biodiversity and Conservation 6: 153-175 (1997) [Google Scholar]
- Amaral, A.C.Z. and S. Jablonski. Conservation Biology 19: 625-631 (2005) [Google Scholar]
- Abbott, R.T. Indo-Pacific Mollusca, Monograph of the Marine Mollusks of the Tropical Western Pacifiic and Indian Ocean (1959) [Google Scholar]
- Abbott, R.T. & Dance, P., Compendium of Seashell (Odyssey, 1990) [Google Scholar]
- Dance, S.P, Eyewitness Handbook Shells (Dorling Kindersley, 1992) [Google Scholar]
- Wilson, B, Australian Marine Shells 2 (Odyssey, 1994) [Google Scholar]
- Matsuura, K. O. K. Sumadhiharga and K. Tsukamoto, Field Guide to Lombok Island. Identification Guide to Marine Organismin Seagrass Beds of Lombok Island, Indonesia, (2000) [Google Scholar]
- Severns, PF., Severns, M., & Dyerly, R, Handy Pocket Guide to Tropical Seashells, (2004) [Google Scholar]
- Dharma, B, Recent and Fossil Indonesian Shells, (Conch Books: Hackenheim, Germany, 2005) [Google Scholar]
- Odum E. P., Barret G. W. Fundamentals of ecology 5th edition (Cengage Learning, 2004) [Google Scholar]
- Rahmawati., M.A. Sarong, Z.A. Muchlisin., S. Sugianto. International Journal of The Bioflux Society. 8, 3 (2015) [Google Scholar]
- Radwin G. E., D’Atillio A, Murex shells of the world: an illustrated guide to the Muricidae (1976). [Google Scholar]
- Apte D, The Book of Indian Shells (Calcutta: Oxford University Press, 1998) [Google Scholar]
- Tsuchiya K, Phenacolepadidae. Marine molluscs in Japan (Tokai University Press, Tokyo, 2000) [Google Scholar]
- Mills S. W., Mullineaux L. S., Tyler P. A. The Biological Bulletin 212(3) (2007) [Google Scholar]
- Zamprogno G. C., Costa M. B., Barbiero D. C., Ferreira B. S., Souza F. T. V. M. Latin American Journal of Aquatic Research 41, 5 (2013) [Google Scholar]
- Georgiev D., Kostov D., Vladova D. Trakia Journal of Sciences 7, 2 (2009) [Google Scholar]
- Davie J., Sumardja E. Tropical Biodiversity 4(1): 1-33 (1997) [Google Scholar]
- Gilman E., Van Lavieren H., Ellison J., Jungblut V., Wilson L., Areki F., Brighouse G., Bungitak J., Dus E., Henry M., Sauni I.Jr., Kilman M., Matthews E., Teariki-Ruatu N., Tukia S., Yuknavage K. 2006. Pacific Island Mangroves in a Changing Climate and Rising Sea. United Nations Environment Programme Regional Seas Programme. [Google Scholar]
- Merle D., Houart R. Bollettino Malacologica Roma 39:161–176 (2004) [Google Scholar]
- Kumbhar J. V., Rivonker C. U. Turkish Journal of Fisheries and Aquatic Sciences 12:189–197 (2012) [Google Scholar]
- Arbi U.Y., Vimono, I.B., Suyatno, A.P., Keanekaragaman Gastropoda di Pesisir Gunungkidul, Yogyakarta (Jakarta, LIPI Press, 2015) [Google Scholar]
- Purchon, R.P., The Biology of the Mollusca. Second edition. Vol. 57. Pergamonpress (Oxford, New York, 1977) [Google Scholar]
- Soegianto, A., Ekologi Kuantitatif: Metode Analisa Populasi dan Komunitas (Airlangga University–Press, Surabaya, 1994) [Google Scholar]
- Odum, E. P, Dasar-Dasar Ekologi: edisi ketiga (Yogyakarta: Gadjah Mada University Press, 1996) [Google Scholar]
- Poole RW., An Introduction to Quantitive Ecology (McGraw Hill, New York, 1974) [Google Scholar]
All Tables
All Figures
|
Fig. 1. Total number of individuals of molluscs in each zone |
| In the text | |
Current usage metrics show cumulative count of Article Views (full-text article views including HTML views, PDF and ePub downloads, according to the available data) and Abstracts Views on Vision4Press platform.
Data correspond to usage on the plateform after 2015. The current usage metrics is available 48-96 hours after online publication and is updated daily on week days.
Initial download of the metrics may take a while.