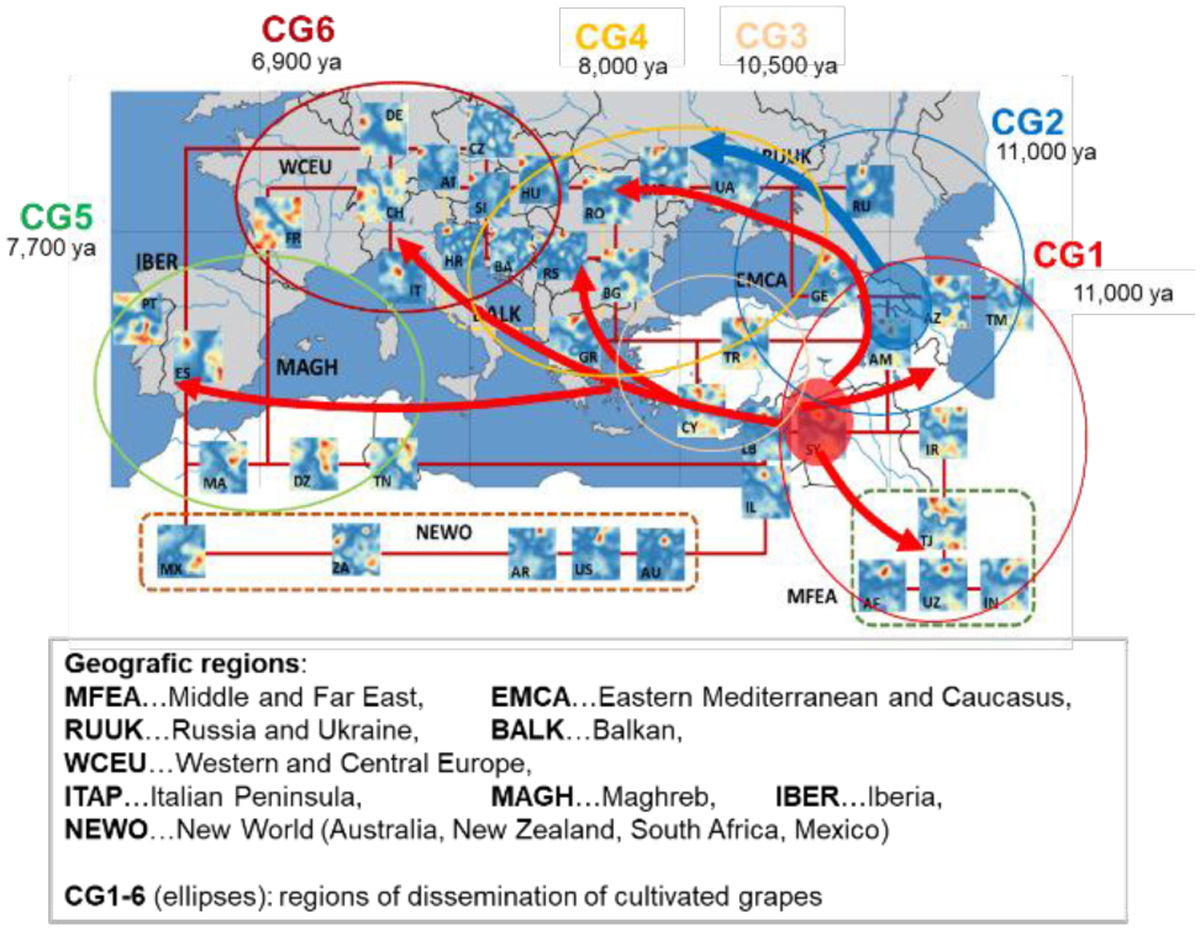
Figure 2
Download original image
Metro map of distribution of cultivated grapes collected from 41 countries around the Mediterranean Sea. Country-wise SOM-portraits are linked by lines according to mutual similarity relations (see [3] for details). The map resembles the dissemination routes of cultivated grapes which originated from two areas of primary cultivation in the Caucasus (blue, CG2) and near East (red, CG1) around 11,000 years ago [1]. CG1 distributed towards the east and the west in the following thousand years as indicated (ya…years ago) and mainly constituted the diversity of grapes observed nowadays. The CG-clusters well agree with the regions included in the ellipses.
Current usage metrics show cumulative count of Article Views (full-text article views including HTML views, PDF and ePub downloads, according to the available data) and Abstracts Views on Vision4Press platform.
Data correspond to usage on the plateform after 2015. The current usage metrics is available 48-96 hours after online publication and is updated daily on week days.
Initial download of the metrics may take a while.