Figure 7
Download original image
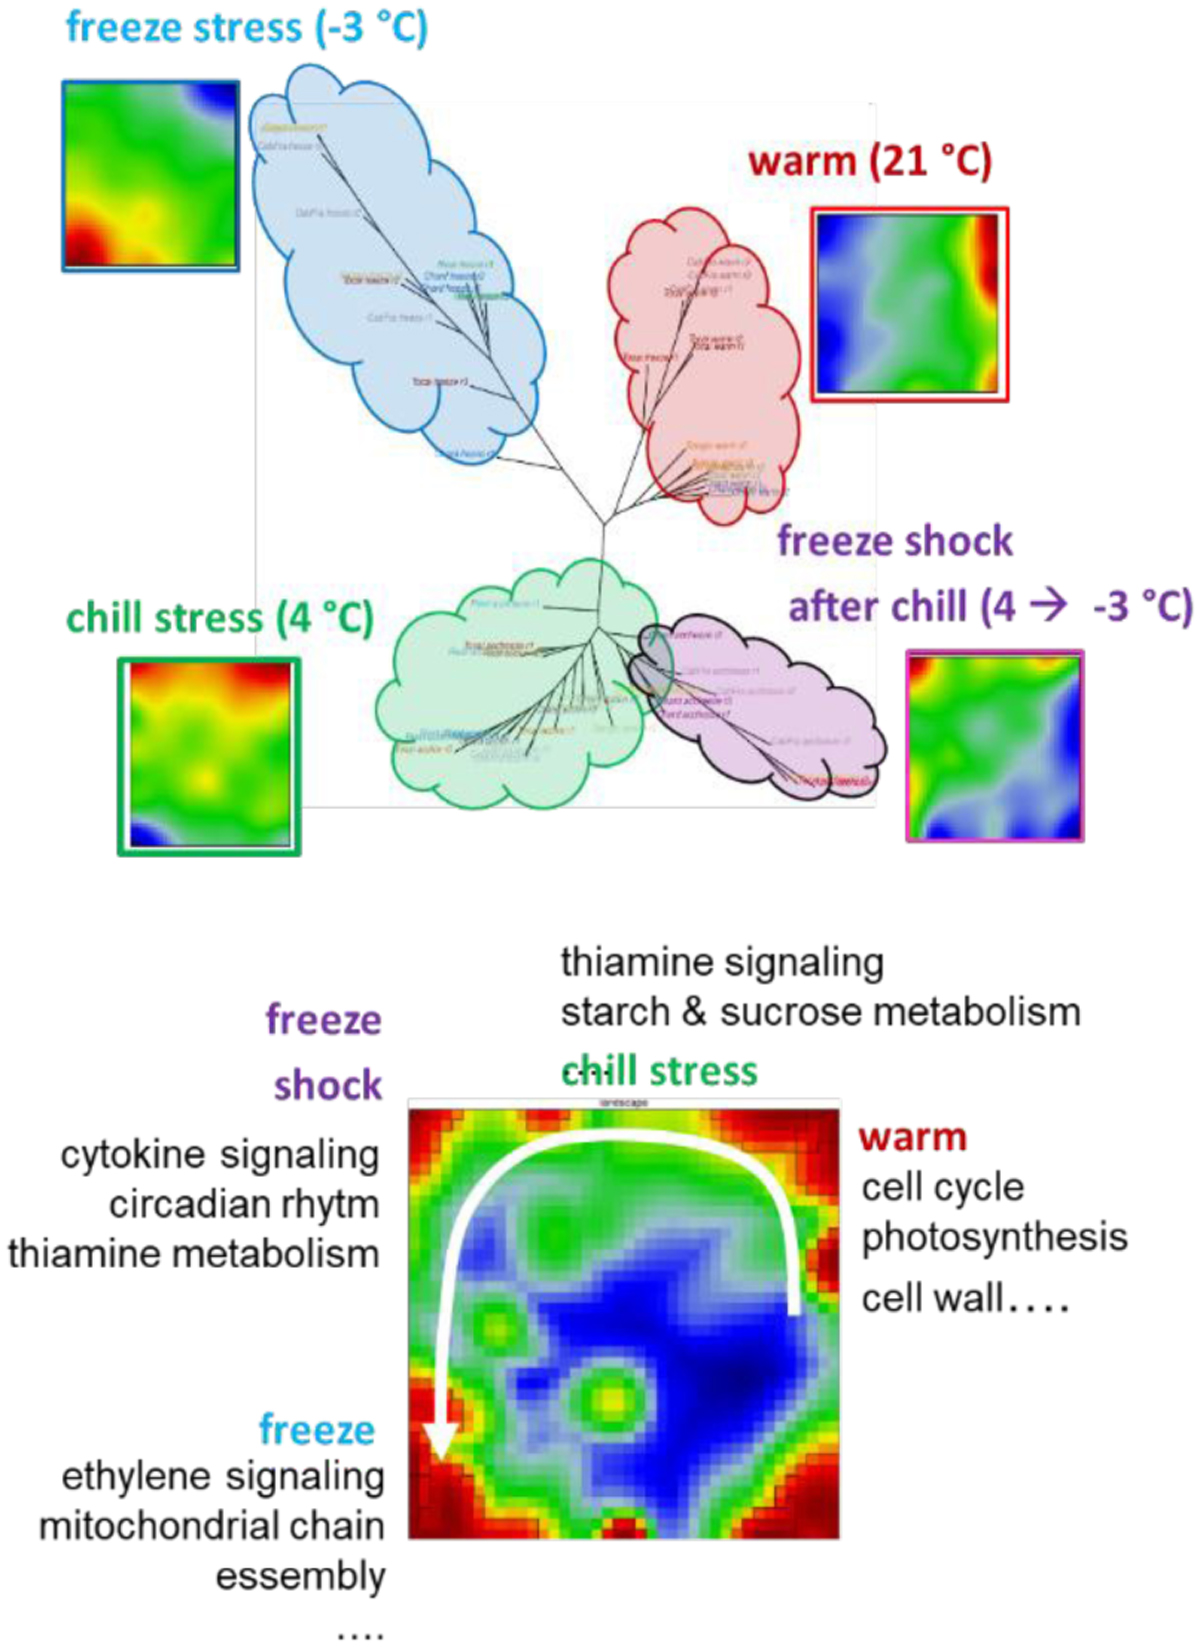
SOM portrayal of vine transcriptomics under temperature stress. The phylogenetic tree clusters the transcriptomes extracted from grapevine leaves (five accessions, three replicates) into disjunct clusters, each related to one of the four temperature conditions applied to the plants. Each cluster is characterized by its specific transcriptional state as visualized by its transcriptomics portrait. Part below: the overview landscape summarizes the observed modules of overexpressed genes (red spots), which can be assigned to certain biological functions using previous knowledge and gene set enrichment techniques. The white arrow illustrates a “stress trajectory” pointing from normal, “warm” reference state via cold (chill and freeze shock stress) towards freeze stress. RNAseq data were taken from [12].
Current usage metrics show cumulative count of Article Views (full-text article views including HTML views, PDF and ePub downloads, according to the available data) and Abstracts Views on Vision4Press platform.
Data correspond to usage on the plateform after 2015. The current usage metrics is available 48-96 hours after online publication and is updated daily on week days.
Initial download of the metrics may take a while.