Open Access
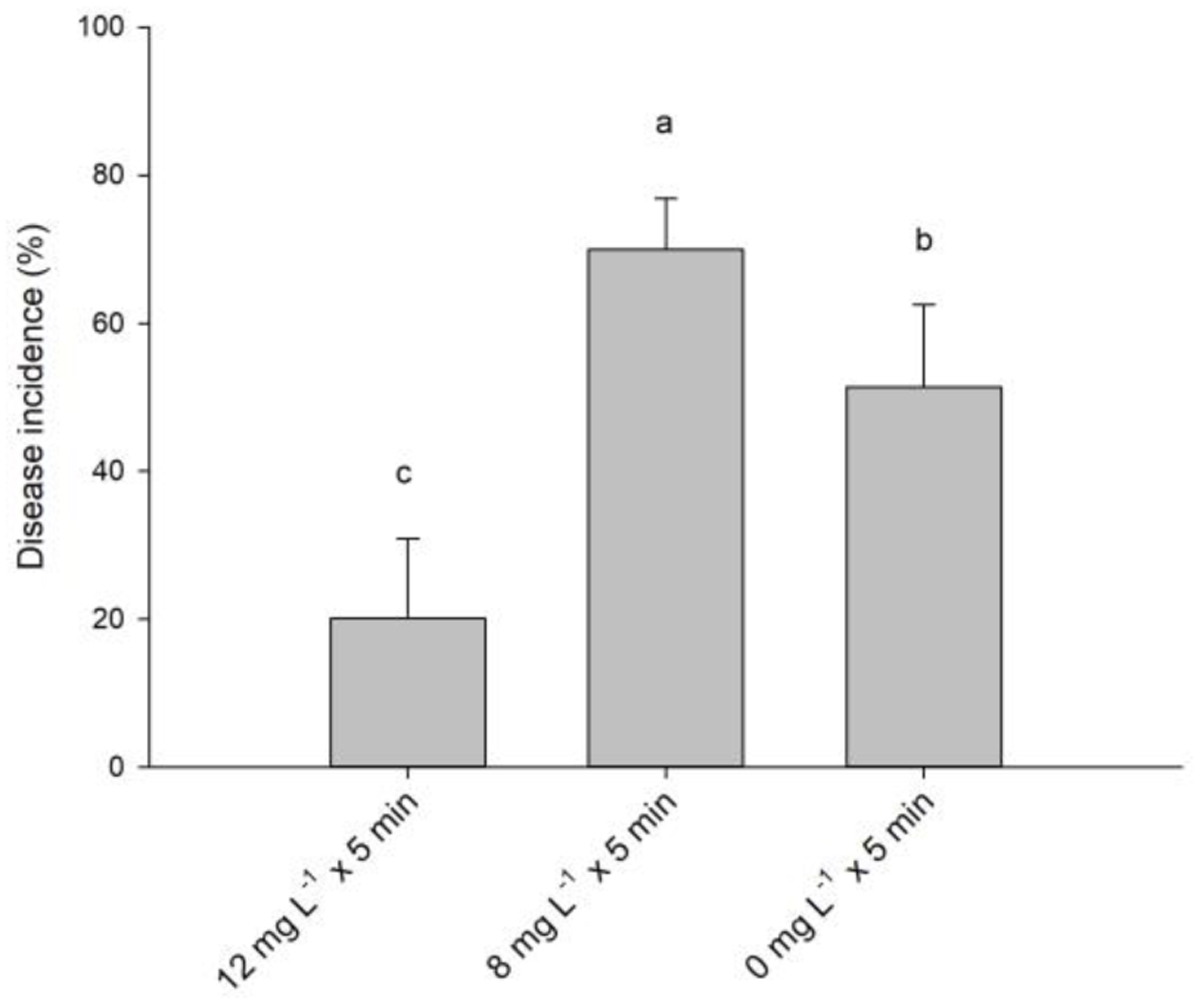
Figure 3
Download original image
Disease incidence (DI) evaluation results. Data are shown as a mean of eight replicates with standard deviation (vertical bars). Bars labeled by different letters are significantly different according to the Tukey’s test (p <0.05).
Current usage metrics show cumulative count of Article Views (full-text article views including HTML views, PDF and ePub downloads, according to the available data) and Abstracts Views on Vision4Press platform.
Data correspond to usage on the plateform after 2015. The current usage metrics is available 48-96 hours after online publication and is updated daily on week days.
Initial download of the metrics may take a while.