| Issue |
BIO Web Conf.
Volume 68, 2023
44th World Congress of Vine and Wine
|
|
|---|---|---|
| Article Number | 04008 | |
| Number of page(s) | 10 | |
| Section | Health | |
| DOI | https://doi.org/10.1051/bioconf/20236804008 | |
| Published online | 23 November 2023 | |
Modelling the co-digestion of wine polyphenols with glucose, proteins and lipids in the human gastrointestinal tract
Institute of Food Science Research (CIAL), CSIC-UAM, c/Nicolás Cabrera 9, 28049 Madrid, Spain
Abstract
This study investigates food matrix effects during the co-digestion of red wine with different nutrients, including glucose and whey proteins, as well as olive oil lipids and cholesterol by using the gastrointestinal dynamic simulator simgi®. Co-digestion with red wine led to a reduction of glucose bioaccessibility and of α-lactalbumin gastric digestibility. In relation to lipids, the co-digestion with red wine tended to increase the percentage of bioaccessible monoglycerides, although significant differences were not found. Interestingly, co-digestion with red wine tended to reduce cholesterol bioaccessibility, which could be related to the decrease in bile salt content observed in the micellar phase. Furthermore, co-digestion with the food models modified wine polyphenols profiles during gastrointestinal digestion, including their bioaccessible and non-bioaccessible fractions. At colonic level, combined intake of wine and each food model affected colonic microbiota composition and functionality. In particular, wine digestion favoured intestinal health-related taxa, and the co-digestion of wine and food models favoured production of total short and medium chain fatty acids, especially butyric and pentanoic acids. Finally, cytotoxicity of the colonic-digested samples towards human colon adenocarcinoma cells was found to be significantly lower for the Wine and Wine+Lipid models than for the Lipid model and the control.
© The Authors, published by EDP Sciences, 2023
 This is an Open Access article distributed under the terms of the Creative Commons Attribution License 4.0, which permits unrestricted use, distribution, and reproduction in any medium, provided the original work is properly cited.
1 Introduction
Wine is considered a dietary source of phytochemicals, and, in particular, red wine is rich in a great variety of (poly)phenolic compounds (mainly flavan-3-ols, anthocyanins, flavonols, and phenolic acids). However, emerging in vitro and in vivo studies suggest that the beneficial actions reported for wine consumption are mainly attributed to the bioaccessible phenolic microbial metabolites derived from the interactions between wine polyphenols and gut microbiome rather than the initial wine precursors [1-3]. In particular, polyphenol intake could have an impact on bioavailability and interactions with nutrients, which could give polyphenols a very different role. Beneficial health effects of wine polyphenols depend on their absorption, metabolism and bioavailability. In general, dietary polyphenols exhibit poor bioaccessibility (the fraction that is released from the food matrix and available for absorption in the gut), which limits their bioavailability (the fraction that reaches the systemic circulation and tissues to exert a biological action). Thus, a key aspect of wine polyphenols research is to explore interactions with other food components during digestion (such as carbohydrates, lipids and proteins) that may affect their bioaccessibility and bioavailability. However, so far, the effect of co-digestion has hardly been explored. This study aimed to investigate the reciprocal effects of wine polyphenols and different food matrices during their co- digestion using the dynamic gastrointestinal simulator simgi®.
2 Materials and methods
2.1 Formulation of food models and Gastrointestinal digestion simulations
Food matrix effects during the co-digestion of red wine (Cabernet Sauvignon and Cabernet Franc, vintage 2006) with different nutrients, including glucose and whey proteins, as well as olive oil lipids and cholesterol by using the gastrointestinal dynamic simulator simgi® (http:/www.cial.uam-csic.es/simgi/) [1]. The system was fed three times with each food matrix/model (Wine, Wine+Nutrient, Nutrient), making a moderate dietary intake of 225 mL for red wine + 15.6 mg of glucose or 6.75 g of whey protein concentrate (as protein food model) or 9.9 g of olive oil and 343.8 mg of cholesterol (as Lipid food model) [4, 5]. Glucose matrix food models were prepared with D-glucose; the amount was selected based on World Health Organization (WHO) recommendations to limit free sugar ingestion to 5% of the total daily caloric intake (also included in Grupo Colaborativo de la Sociedad Española de Nutrición Comunitaria [6]). Considering 125 kcal of sugar intake per day (2,500 kcal/day and 4 kcal/g of sugar) the maximum amount of daily sugar intake was calculated (31.3 g/day) and, for the food model formulation, the half of the daily sugar consumption was considered. Protein matrix food models were prepared with a commercial whey protein concentrate (WPC) (Capsa Foods, Spain), considering previous research of protein digestion [7]. Lipid food model was established according to the daily reference intakes described in different nutritional guides, which reported an average of 2,500 kcal/day and a minimum of 7% kcal intake contributed by monounsaturated fatty acids [6].
Gastrointestinal digestions of the three food models were carried out separately using the dynamic gastrointestinal model simgi® [1]. Simgi® system (http://www.cial.uam- csic.es/simgi/) is a computer-controlled gastrointestinal in vitro model designed to simulate the physiological processes taking place during digestion in the stomach and small intestine, while also reproducing the colonic microbiota responsible for metabolic bioconversions in the large intestine [1]. Flexible and modular design of the system allows continuous or staged simulation of its compartments. Gastrointestinal digestions in this study were performed by using just the stomach (ST) and small intestine (SI) compartments operating continuously. Before each gastrointestinal digestion, the system was preconditioned: the stomach compartment was pre-filled with 65 mL of simulated gastric fluid (SGF) (pH 2.0) and the small intestine with 55 mL of simulated intestinal fluid (SIF) (pH 7.0). Once the system was conditioned, the intake (80 mL) of each studied food model flowed to the ST, where the peristaltic movements mixed the food model content with the fasting content. Then, 15 mL of simulated gastric juice flowed to the ST. During gastric digestion, HCl was added gradually until the pH reached 1.8. To simulate physiological gastric emptying, the Elashoff function [8] was used to determine the gastric emptying flow to the SI. During SI digestion, the arriving chemo (95 mL) was mixed with 40 mL of simulated pancreatic juice and the fasting SI content. Anaerobic conditions (150 rpm, 37 °C and pH 7.0 ± 0.2) were maintained during the 120 minutes of intestinal digestion. For the three food models, gastrointestinal digestions were carried out in duplicate. Samples of the food models after SI digestion were collected and kept at -20 °C until analysis of wine phenolic compounds. Aliquots of the SI contents were also collected for further bioaccessibility studies [4, 5].
2.2 In vitro bioaccessibility
For Glucose matrix food models’ digestions, bioaccessibility of glucose was evaluated at the endpoint of the intestinal digestion according to the methodology previously proposed [9]. Samples of the dialysate were taken by triplicate at 4, 30, 60, 90, 120 and 150 min on every dialysis simulation. Colorimetric D-Glucose Assay kit (GOPOD Format, from Megazyme, Ireland) was used to quantify glucose concentrations on food models, digested samples and dialysates. Glucose bioaccessibility was calculated as it is described on Eq. (1):
 (1)
(1)
Glucose Dialysis Retardation Index (GDRI) was calculated as described on Eq. (2):
 (2)
(2)
Regarding Lipid model, after gastrointestinal digestion the micellar aqueous phase (considered as the bioaccessible fraction) of the digesta SI content (30 mL) was isolated by centrifugation at 4000 rpm for 40 min at room temperature [10]. Non-micellar phase (considered as the non-absorbable fraction) was separated and kept at −80 °C for further colonic fermentation. For the Wine+Lipid and Lipid food models, samples of the SI content before micellar separation and samples of isolated micellar phases were analyzed for lipids (monoglycerides, free fatty acids and cholesterol) and bile salts. Based on these contents, their bioaccessibility was calculated according to Eq. (3) [10]:
 (3)
(3)
2.3 In vitro colonic fermentations
For each food model, non-absorbable fractions from the gastrointestinal digestion were subjected to static colonic fermentations. Fermentations were carried out in triplicate and samples were collected at 0, 24 and 48 h. An immediately collected sample aliquot (1 mL) was used for microbial counts. Other aliquots were centrifuged at 10,000 rpm at 4 °C for 10 min to separate supernatant and pellet fractions. Supernatants were filtered through 0.22 µm PVDF filters (Symta, Spain) and kept at -80 °C until further assessment for cell cytoprotection/cytotoxicity and analysis of microbial-derived metabolites. Pellets were kept at -80 °C until DNA extraction with an optimized protocol.
2.4 Cell cytoprotection/cytotoxicity assay
Two human colon adenocarcinoma cell lines, HCT-116 (ATCC® CCL-247™) and HT-29 (ATCC® HTB-38™), cultured as described previously [11], were used to evaluate cell cytoprotection/cytotoxicity. Supernatants from colonic fermentations (0 and 48 h) were defrozen and diluted (10%, 25%, 50% and 75%, v/v) with serum-free cell culture medium. Then, cytoprotection/cytotoxicity towards HCT-116 and HT-29 cells was measured using the MTT cell viability assay for 4 and 24 h, as previously reported [11]. Results were expressed as cell viability (%) in comparison to the values in the absence of supernatants (control). Assays were performed in triplicate and two independent experiments were carried out.
2.5 Analysis of wine phenolic compounds by UPLC-MS
Samples from gastrointestinal digestions were defrosted and filtered through 0.22 µm PVDF filters (Symta, Spain). Analysis of wine non-anthocyanin phenolics was carried out by UPLC-ESI-MS/MS following a previously reported method [12], while wine anthocyanins were analysed following the method described [13]. Analyses were carried out in triplicate.
2.6 Analysis of lipids and bile salts by GC-FID- MS
Extraction of lipids (monoglycerides (MGs), free fatty acids (FFAs) and cholesterol) and bile salts was carried out as described [10]. The lipid phase of each sample was extracted with hexane:methyl tert-butyl ether (50:50 v/v) with a ratio of 3:1 (v/v) of solvent to sample. This mixture was vortexed for 1 min and centrifuged for 10 min at 3000 rpm. The upper organic phase was collected while the aqueous phase was extracted again with chloroform: methanol (2:1 v/v) at a ratio of 3:1 (v/v). The two organic phases obtained were mixed, and a rotary evaporator was used to remove the solvent. Analysis and quantitation of MGs, FFAs, cholesterol and bile salts were performed by gas chromatography-flame ionization-mass spectrometry (GC-FID-MS) previous derivatization by silylation as described [14]. Analyses were carried out in triplicate.
2.7 Microbial community analyses and colonic metabolic activity assessments
2.7.1 Microbial plate counting
Immediately after sampling, tenfold serial dilutions of the content of each colonic fermentation baker were plated on different types of selective media as described [15]. Plate counting was done in triplicate and data were expressed as log of colony-forming units per millilitre (CFU/mL). Analyses were carried out in triplicate.
2.7.2 DNA extraction, sequencing and data processing
In order to ensure enough recovery, replicate pellets (n = 3) were pooled before DNA extraction. The QIAamp DNA Stool Mini Kit (Qiagen, Germany) was used for DNA extraction following the manufacturer’s instructions. As described [16], the V3-V4 region of the 16S ribosomal RNA gene was amplified, and a two-step Illumina® PCR protocol was followed to prepare the libraries. Samples were submitted to 2 x 300 bp paired- end sequencing utilizing an Illumina® MiSeq instrument (Illumina®, USA). RStudio v.1.3.1093 software was employed to process the files with raw reads from the Illumina® instrument, using the DADA2 algorithm [17, 18] to denoise joined paired-end reads and filter out chimaeras in the raw data. Silva v.138 was used as the reference database [19]. A total of 533 amplicon sequence variants (ASVs) were found. Biodiversity, expressed in terms of alpha diversity, was estimated using the ASVs by calculating the Observed, Shannon and Simpson indices through the “Phyloseq” package. Beta-diversity was evaluated employing a Bray-Curtis dissimilarity matrix represented by non-metric multidimensional scaling (NMDS).
2.7.3 Phenolic metabolites analysis by UPLC-MS
Phenolic metabolites targeted in the study (mandelic acids, benzoic acids, phenols, hippuric acids, phenylacetic acids, phenylpropionic acids, cinnamic acids, 4-hydroxyvaleric acids and valerolactones) were analysed by UPLC-ESI-MS/MS [20]. Analyses were carried out in duplicate.
2.7.4 Fatty acids analysis by GC-MS
Short-chain fatty acids (SCFAs) (acetic, propionic, butyric, isobutyric, valeric and isovaleric acids) and medium-chain fatty acids (MCFAs) (hexanoic, heptanoic, octanoic and decanoic acids) were analysed by SPME- GCMS as previously described [1, 21]. Briefly, filtered supernatants or calibration stock solutions (290 μL) were mixed with 10 μL of IS solution (2-methylvaleric acid, 1 g/L) and 30 μL of H2SO4 solution (0.9 N). Two aliquots of 100 μL of each treated sample were transferred to two 20 mL hermetically sealed vials. Analyses were carried out in duplicate.
2.8 Statistical analysis and data treatment
To study the variance among Wine+Glucose and Wine+Protein food models and times, two-way ANOVAs were carried out for the total phenolic content of the model foods and the digested samples at the upper gastrointestinal tract (GIT) within the same digestion stage. Games-Howell post-hoc analyses was done to calculate significant differences. On the dialysis curves, differences in glucose mean concentrations with and without wine were studied by Mann-Whitney U paired- samples tests within each dialysis time. Differences in the bioaccessibility of lipids and bile salts were studied using the Mann-Whitney U paired-samples test. Analysis of variance (two-way ANOVA) was used to study the differences between food models and incubation times for plate counting and SCFA concentration in colonic- digested samples. Significant differences were calculated using the Bonferroni test for SCFA production, and the Games-Howell test was carried out for plate counting. Analysis of variance (one-way ANOVA) was used to study the differences between food models for cell cytotoxicity data within each cell line, exposition time and dilution. Significant differences were calculated considering p < 0.05 for all the analyses. Statistical analyses were carried out with the XLSTAT Statistic for Microsoft Excel, version 2020.1 (Addinsoft-SARL, USA).
3 Results and Discussion
3.1 Effect of wine on the bioaccessibility of glucose
The bioaccessibility of glucose in Glucose matrix food models was determined in terms of glucose diffusion across the dialysis membranes. Results are collected in Fig. 1. As expected, glucose concentration in the dialysate increased over time for both food models. Further, Wine+Glucose feeding showed significantly lower percentages in the dialysate respect Glucose food model at each time point, reducing up to 50% the value of bioaccessible glucose at the end of the dialysis simulation.
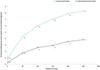 |
Figure 1 Glucose diffusion through dialysis membranes Glucose and Wine+Glucose food models at the endpoint of small intestinal digestion. Data are expressed as mean ± standard deviation of bioaccessible glucose calculated as described on Eq. (1). Lowercase letters denote significant differences between food models at the same dialysis time. |
3.2 Effect of wine on protein digestion
The products released during the dynamic simulated gastrointestinal digestion of Protein matrix food models. At gastric level, α-lactalbumin (which is partly resistant to gastric digestion) presented different behaviour in the Protein and Wine+Protein food models. For the Protein food model, the α-lactalbumin band was detected until 30 min of gastric digestion, but in the presence of wine, it remained detectable until 120 min, suggesting protein- wine polyphenols interactions that prevent protein digestion. Similar effects have been described for some phenolic compounds such as caffeic, ferulic and coumaric acids [22, 23].
However, for both food models, α-lactalbumin was completely digested at the endpoint of the intestinal phase. β-lactoglobulin remained in the stomach after 120 min for both, Protein food model and Wine+Protein food models. However, it was hardly detected at the endpoint of small intestinal digestion. This might happen as well with α-lactalbumin, which would explain the resistance of this protein to digestion, as opposed to its behaviour in the absence of wine. On the other hand, phenolic compounds have shown inhibition of protein aggregation. This might render β-lactoglobulin aggregates more susceptible to the enzymatic action in the presence of wine.
3.3 Effect of glucose and protein food matrix on wine polyphenols digestion
The reduction percentage of total phenolic content from gastric digestion to the endpoint of the small intestinal digestion was 45% for wine, in agreement to the value reported for static in vitro digestion of a red wine [24]. Similar reduction values were found for wine polyphenols in the other food matrices (46 and 41% for protein and glucose, respectively). Among individual compounds, tyrosol, coutaric acid and caftaric acid were not detectable after gastric digestion while ellagic acid, myricetin, procyanidins and anthocyanins were not detected after small intestinal digestion. Most of all the analysed polyphenols suffer considerable (>50%) degradation during small intestinal digestion although gastric stage affected differently to each compound family. Differences in the phenolic profile between food matrices during gastrointestinal digestion are summarized in Fig. 2. Regarding the Wine+Glucose food model, it is remarkable the prevalence of procyanidin dimer B1 and the decrease of quercetin-3-O-glucoside at the end of small intestinal digestion, which degradation is up almost 40% compared with Wine food model. Ellagic acid, resveratrol, kaempferol, myricetins, the procyanidins and other trimers present at the endpoint of gastric digestion were not detected after the intestinal stage. Wine+Protein food model presented limited effects on phenolic profile prevalence during digestion with all differences under 5% compared to wine digestion, except for (+)-catechin, piceid and caffeic acid at intestinal level. Our results indicate that those interactions might prevent phenolic compounds from degradation during digestion, acting as carriers of polyphenols through the GIT as it was previously suggested [25], although more studies are needed due to the diversity of polyphenols in foods and the structural complexity of proteins.
The comparison of phenolic profile of the studied Wine+Matrix food models after dialysis is shown in Fig. 3. Wine+Glucose food model favoured the retention of kaempferol, piceid, resveratrol, vanillic acid, 4-hydroxybenzoic acid, gallic acid and protocatechuic acid in the retentate (non-absorbable fraction) and, for hence, their presence at colonic level.
On the other hand, (-)-epicatechin, p-coumaric acid and caffeic acid concentration in the dialysate (absorbable fraction) would favour the bioaccessibility of these compounds respect to the wine model. Meanwhile, the Wine+Protein food model favoured the retention of kaempferol, piceid, p-coumaric, caffeic and syringic, 4- hydroxybenzoic acid compared with wine food model. Hydroxybenzoic acids, in particular ethyl gallate and protocatechic acid, presented higher values for both retained and dialysate fractions because their concentration at the endpoint of intestinal digestion is higher in Wine+Protein food model than in Wine food model. Interestingly, co-digestion of wine and whey proteins would increase the concentration of these compounds at colonic level, favouring its availability to microbiota colonic fermentation.
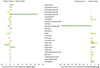 |
Figure 2 Phenolic compounds in the food matrix models (Wine+Glucose and Wine+Protein) at the gastric and small intestine stages. Data are expressed as % increment of wine phenolic compounds for each food model respect to the Wine food model. |
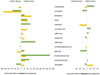 |
Figure 3 Phenolic compound bioaccessibility from the food matrix models (Wine+Glucose and Wine+Protein) at the small intestine stage. Data are expressed as % increment of wine phenolic compounds for each food model respect to the Wine food model. |
3.4 Effect of wine and lipid co-digestion on phenolic profile
For the Lipid food model, negligible contents of phenolic compounds were found. In general, intestinal digestion led to reductions (>50%) of most wine phenolic compounds, as seen for both Wine and Wine+Lipid food models (data not shown). The disappearance of ellagic acid, tyrosol, esterified hydroxycinnamic acids (coutaric and caftaric acids), procyanidins and anthocyanins at the end point of the SI stage is worthy of note. In contrast, concentrations of some phenolic acids such as protocatechuic, 4-hydroxybenzoic and vanillic, syringic and p-coumaric acids seemed slightly affected or almost not affected after gastrointestinal digestion. Figure 4 graphically compares values of those phenolic compounds detected after gastrointestinal digestion for both Wine and Wine+Lipid food models. For most of the phenolic compounds, concentrations after gastrointestinal digestion were lower in the Wine+Lipid model than in the Wine model, a finding that was also observed for the initial food models. However, lipid co-digestion led to a relatively higher concentration of piceid (resveratrol-3-O- glucoside) in the Wine+Lipid food model (Fig. 4b). This finding suggested that the hydrolysis of piceid into resveratrol that occurred through the gastrointestinal stage was aminorated in the presence of lipids. In the same way, gastrointestinal transformations of some phenolic acids such as vanillic, syringic and p-coumaric acids were delayed in the presence of lipids as concentrations of these compounds were higher in the Wine+Lipid model than in the Wine model after gastrointestinal digestion (Fig. 4b). In spite of the differences in experimental materials and the in vitro digestion conditions, our findings were in agreement with those of previosuly reported [26] and confirmed certain transformations of wine polyphenols during their in vitro gastrointestinal digestion that were lessened by co- digestion with food components (i.e. lipids). The extent of these transformations depends on the chemical structure of the phenolic compounds and might be related to the enzyme load of the simulated juices used in the in vitro simulation systems.
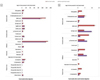 |
Figure 4 Concentration (mg/L of wine present in the food model) of main phenolic compounds in the food model (a) and after intestinal digestion (b) for the Wine and Wine+Lipid food models. Data are expressed in mean values ± standard deviation. |
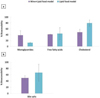 |
Figure 5 Bioaccessibility (%) of free fatty acids, monoglycerides and cholesterol (a) and bioaccessibility of bile salts (b) for the Wine+Lipid and Lipid food models. Data are expressed in mean values ± standard deviation. |
3.5 Effect of wine and lipid co-digestion on lipids bioaccessibility
The bioaccessibility of the released lipid products from triglycerides of olive oil (mainly MGs and FFAs) together with cholesterol, as well as bile salts after simgi® gastrointestinal digestion is shown in Fig. 5.
Although no significant differences (p > 0.05) in bioaccessibility between Lipid and Wine+Lipid food models for any of the lipids analysed were found, a remarkable increase in MGs was observed in the co- digestion with wine (from 13% to 39% bioaccessibility) (Fig. 5a). In contrast, a noticeable reduction in bioaccessibility was observed for cholesterol (from 80 to 49%) and bile salts (from 67 to 50%) when lipids were co-digested with red wine (Figs. 5a and 5b, respectively). However, FFAs showed similar mean values for both food models (42 and 44 %). Although non-significant differences in cholesterol bioaccessibility between Wine+Lipid and Lipid models were observed, its reduction tendency might be supported by that observed in bile salt bioaccessibility (Fig. 5a). Therefore, our results concerning lipid bioaccessibility may contribute elucidating the mechanisms underlying the hypocholesterolemic effects of red wine and red wine polyphenols observed in vivo [27-31], although further research is needed to better understand the interactions among wine components, cholesterol and bile salts during gastrointestinal digestion.
3.6 Impact of wine, glucose and protein food models on colonic microbiota composition and metabolism
The study of food matrix effect on the growth of colonic microbiota was evaluated by plate counting as a first approach considering the CNM colonic fermentation as a control of the colonic microbiota evolution. Regarding bacterial groups on the Protein matrix food models, it is only remarkable a significant reduction of viable Clostridium spp. population at 24 h of colonic fermentation for Wine food model. Considering Glucose matrix colonic fermentations, Wine+Glucose food model microbial groups evolved differently. Total aerobes and Enterobacteriaceae family were significantly reduced after 24 h of fermentation. Furthermore, at 48 h, Clostridium spp. were not countable, while Lactobacillus spp. group showed a significant increase respect to the control.
Complementarily, 16S rRNA gene sequence analysis and subsequent calculation of microbial diversity indexes were carried out on pooled samples for the same food model and time. The analysis of the alpha-diversity in terms of observed species and Shannon index for Glucose and Wine+Glucose food models showed less diversity after 48 h, while Wine food model colonic fermentation resulted in a similar trend to that observed for control. The changes in alpha-diversity could be related with the differences between fast-growing bacteria and slow- growing bacteria, which might increase their numbers at later phases of colonic fermentation. Regarding Protein matrix colonic fermentations, Wine and Wine+Protein food models showed more diversity indices comparing to control and Protein food models. Beta-diversity analysis revealed different clusters of samples, suggesting that 16S rRNA gene profiling of the samples of Wine food model were more similar to control samples in any time tested. Phylogenetic analysis at phylum level showed that the Glucose model increased Firmicutes proportions and decreased Bacteroidetes and Proteobacteria levels respect to control, thus increasing the Firmicutes/Bacteroidetes ratio, which is considered a marker of intestinal health. Wine food model exhibited a similar profile to control, whereas Wine+Glucose combination seemed to revert in part the glucose effect in the microbiota, increasing Bacteroidetes proportions and maintaining Firmicutes levels. Regarding the most relevant members of the microbiota at genus level, results supported the trends previously observed, highlighting the Bacteroides proportions drop in Glucose food model and the possible reverting effect of wine, considering Wine+Glucose food model results. Glucose food matrix models showed lower levels in the key health-related taxa Akkermansia respect to control, although Wine food model increased relative abundance after 48 hours. The increase of Akkermansia has also been observed in distal dynamic in vitro models after simulated digestion of red wine extract [32] and in human faecal microbiota after moderate wine intake [33]. Prevotella proportions were higher in Glucose and, specially, Wine+Glucose food model respect to control. In human intervention with red wine, Prevotella spp. appeared as positively correlated with the total faecal concentration of polyphenols and showed the highest positive correlation value with the total concentration of faecal SCFAs [33], constituting one of the main species of healthy human gut. Faecalibacterium levels decreased in Glucose and Wine food models, however, the combination of Wine+Glucose produced an increment in their levels, being detected the same trend in Bifidobacterium abundance. For protein food matrix colonic fermentations, results showed lower levels for Enterobacteriaceae in all the conditions at 48 h. Nevertheless, the decrease in the proportions of this family was higher for Protein than for Wine+Protein food model. The decrease in Bifidobacterium proportions after 48 h was not detected in Wine and Wine+Protein food models, showing the putative gut protective effect of wine.
Regarding microbiota metabolism, caffeic acid and p- cumaric acid present at 0 hour in Wine and Wine+Matrix food models were degraded after 48 hours of fermentation (data not shown). This same was observed for protocatechuic acid in Protein matrix food model’s fermentation. There is particularly significant the increase of phenylacetic, 4-hydroxyphenylacetic and phenylpropionic acids for both food matrices because these compounds are metabolites of nutrients from the CNM that is present in all the colonic fermentations. Total SCFAs and MCFAs production during colonic fermentation increased significantly for Wine+Glucose food model and Wine+Protein food model respect to wine (data not shown). This is mainly remarkable in the case of butyric acid, which could be explained for the higher total phenolic concentration of Wine+Matrix food models proceeding from the non-absorbable fraction, especially contributed by flavonols, cinnamic and benzoic acids.
3.7 Effect of wine and lipid co-digestion on colonic microbiota composition and metabolism
According to plate counting results, at 0 h, there were no significant differences within food models for any tested bacterial groups (data not shown). After 48 h of colonic fermentation, Enterococcus spp., lactic acid bacteria and Bifidobacterium spp. presented lower values in the Wine food model than the control colonic fermentation, in contrast to the observed effect in other red wine colonic fermentations [4]. However, the expected increase (p < 0.05) was observed for these microbial groups in the Wine+Lipid food model, coinciding with the effects generally observed in red wine and grape seed extract colonic fermentations and in vivo intervention studies [34-36], but also in several polyphenol supplementation studies [37]. Changes in microbial populations were also evaluated by 16S rRNA gene sequence analysis. At the endpoint of colonic fermentation (48 hours), the Wine and Wine+Lipid food models showed higher diversity values than the Lipid food model and the fermentation control (no food model addition). This observed effect could be related with the phenolic content after gastrointestinal digestion related with wine presence in both food models, especially considering that red wine polyphenols have been extensively related with the increase of alpha-diversity [34,38,39]. The beta- diversity analysis did not reveal any changes between the different treatments, grouping the samples only for colonic fermentation time (data not shown). Otherwise, phylogenetic analysis at the phylum level is shown in Fig. 6.
The Lipid food model slightly increased Firmicutes proportions, while the other phyla displayed the same trend as the control. Wine and Wine+Lipid food models showed a pattern similar to the control colonic fermentation, suggesting that the presence of wine in the food model could partially reverse the observed effect of the Lipid food model in the microbiota. Furthermore, Proteobacteria proportions suffered a slower increase in the presence of wine. This effect is also in line with the observed decrease in Escherichia/Shigella proportions in Wine and Wine+Lipid food models. Delving more deeply into bacterial communities with their key role in host health, Akkermansia, which is associated with the maintenance of the mucus layer of the colon tended to increase during the first 24 hours of colonic fermentation. However, its abundance decreased after 48 hours in the Lipid food model. This trend was not observed in Wine and Wine+Lipid food models, which maintained their abundance values. Overall, the results show that the presence of wine in colonic media (Wine and Wine+Lipid food models) favours health-related taxa.
As a means of colonic microbiota metabolism, the production of fatty acids (SCFAs and MCFAs) and phenolic metabolites after 48 h of colonic fermentation was determined. Production (∆mg/L) of butyric, isobutyric, isovaleric and pentanoic acids, among SCFAs, and hexanoic acid, among MCFAs, was found to be significantly (p < 0.05) lower for all of the food models with respect to the control (data not shown). Among the food models, the Wine+Lipid food model showed a significantly higher production of total SCFA, due in particular to the contribution of butyric and pentanoic acids. Butyric and pentanoic acid production in wine colonic fermentation was significantly higher for the Wine model. As regards phenolic metabolites, the production of 3-(3-hydroxyphenyl)-propionic acid was found to be significantly (p < 0.05) higher for the Wine and Wine+Lipid food models, and the production of 3- (3,4-dihydroxyphenyl)-propionic acid was only observed in the Wine+Lipid food model. Both compounds come from the catabolism of different parent polyphenols present in red wine, and have been previously detected in the faecal and urine metabolomics fingerprint after red wine consumption [2,40,41]. In summary, at the end point of colonic fermentation, it was observed that the Wine and Wine+Lipid food models exhibited some particular differences in colonic microbiota and phenolic metabolites that, albeit slightly, might favourably impact the gut environment.
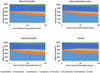 |
Figure 6 Relative abundance at phylum level for the different food models during colonic fermentations. Data are expressed in mean values ± standard deviation. Graphs show the taxa with a relative abundance > 0.5%. |
3.8 Cytoprotection towards colon epithelial cells
As an approach to studying the role of the colonic metabolites inside the lumen, they are assayed for their protective/toxicity effects towards epithelial cell lines. Table 1 reports data on the % cell viability of the two cell lines tested (HCT-116 and HT-29) after incubation (4 h and 24 h) in the presence of the three colonic-digested food models collected at the beginning (0 h) and after 48 h of colonic fermentation, in comparison to the fermentation control (no food addition). As can be seen, the presence of the intestinal-digested food models counterbalanced this loss of cell viability, and, in general, cytoprotective effects were in the following model order: Wine > Wine+Lipid > Lipid (Table 1). For instance, after 4 h of incubation with the cells, the data on cell viability corresponding to the time point of 48 h of colonic fermentation and 75% concentration were 49.4, 39.5, 35.3 and 26.5%, respectively, for the Wine model, Wine+Lipid model, Lipid model and control towards the HCT-116 cell line, and 69.7, 69.5, 63.1 and 46.8%, respectively, for the Wine model, Wine+Lipid model, Lipid model and control towards the HCT-29 cell line.
Using HT-29 and HCT 116 cell lines, we found that the percentages of cell viability were higher (lower cytotoxicity) for faecal samples collected after the red wine intervention than for those collected before, although significant (p < 0.05) differences were only found in certain assay conditions for both cell lines [11]. The findings of the present study using in vitro colonic- digested wine confirmed these previous ex vivo results in that wine-derived metabolites might exhibit protective activities at the intestinal level. This protection seems to be related to the production of microbial-derived metabolites such as fatty acids and phenolic metabolites, whose faecal contents have been shown to increase after red wine consumption [12].
Viability percentages of HCT-116 and HT-29 cells after exposure to colonic fermentation content at the start point (0 hour) and end point (48 hours) of colonic-stage simulations (mean values ± standard deviation). Columns indicating 10%, 25%, 50% and 75% present the dilutions of the colonic media used for each cell viability assay. Lower-case letters denote statistically significant differences between food models within exposition time (4 or 24 hours) and dilution.
4 Conclusions
As a whole, our results showed that the co-digestion of red wine and the studied food models affected both, wine polyphenols and food model constituents’ digestion and bioaccessibility, as wells as, their colonic metabolism. Co-digestion of the studied red wine reduced glucose bioaccessibility, which is consistent with the hypoglycaemic effects observed in intervention and observational studies related to moderate wine consumption. Our results also confirmed that co- digestion of wine with proteins selectively retard/limit their degradation as it has seen for whey proteins. Although no significant differences were found, the Wine+Lipid co-digestion tended to increase the percentage of bioaccessible monoglycerides and to reduce cholesterol and bile salt bioaccessibility, which was consistent with the hypocholesterolemic effects observed in intervention and epidemiological studies associated with moderate wine consumption. Moreover, we confirmed certain transformations of wine polyphenols during their in vitro gastrointestinal digestion that were lessened by co-digestion with lipids. At the colonic stage, the microbial community evolved differently when the food matrices were co-digested with wine, also leading to higher total SCFA production and, specifically, butyric acid. The colonic-digested samples derived from the Wine and Wine+Lipid food models resulted in being less cytotoxic towards human colon adenocarcinoma cells (HCT-116 and HT-29) than the Lipid model and control (no food addition), indicating potential health-promoting activity in the colonic environment. Lastly, the in vitro results of this work indicate that the simgi® system constitutes a suitable tool for studying the co-digestion effect of polyphenol-rich foods, as it is able to mimic human digestion physiological conditions.
Research in our lab is funded by Grants PID2019- 108851RB-C21 (Spanish Ministry of Science and Innovation) and ALIBIRD-CM 2020 P2018/BAA-4343 (Comunidad de Madrid, Spain).
References
- C. Cueva, A. Jiménez-Girón, I. Muñoz-González, A. Esteban-Fernández, I. Gil-Sánchez, M. Dueñas, P.J. Martín-Álvarez, M.A. Pozo-Bayón, B. Bartolomé, M.V. Moreno-Arribas, Food Res. Int. 72, 149–159 (2015) [CrossRef] [Google Scholar]
- A. Jiménez-Girón, C. Ibáñez, A. Cifuentes, C. Simó, I. Muñoz-González, P.J. Martín-Álvarez, B. Bartolomé, V. Victoria Moreno-Arribas, J. Proteome Res. 14, 897–905 (2015) [CrossRef] [PubMed] [Google Scholar]
- M.V. Moreno-Arribas, B. Bartolomé, J.L. Peñalvo, P. Pérez-Matute, M.J. Motilva, Nutrients 12, 3082 (2020) [CrossRef] [PubMed] [Google Scholar]
- A. Tamargo, C. Cueva, M. Silva, N. Molinero, B. Miralles, B. Bartolomé, M.V. Moreno-Arribas, Food Res. Int. 155, 111010 (2022) [CrossRef] [Google Scholar]
- A. Tamargo, D.G. de Llano, C. Cueva, J.N. Del Hierro, D. Martin, N. Molinero, B. Bartolomé, M.V. Moreno-Arribas, Food Res. Int. 165, 112524 (2023) [CrossRef] [Google Scholar]
- Grupo Colaborativo de la Sociedad Española de Nutrición Comunitaria (SENC), Nutricion Hospitalaria 33, 1–48 (2016) [Google Scholar]
- B. Miralles, R. del Barrio, C. Cueva, I. Recio, L. Amigo, J. Sci. Food Agric. 98, 1873–1879 (2018) [CrossRef] [PubMed] [Google Scholar]
- J.D. Elashoff, T.J. Reedy, J.H. Meyer, Gastroenterology 83, 1306–1312 (1982) [CrossRef] [PubMed] [Google Scholar]
- S. Ou, K.C. Kwok, Y. Li, L. Fu, J.Agric. Food Chem. 49, 1026–1029 (2001) [CrossRef] [PubMed] [Google Scholar]
- D. Martin, J. Navarro Del Hierro, D. Villanueva Bermejo, R. Fernández-Ruiz, T. Fornari, G. Reglero, J. Agric. Food Chem. 64, 8828–8837 (2016) [CrossRef] [PubMed] [Google Scholar]
- I. Zorraquín-Peña, D. González de Llano, A. Tamargo, M.V. Moreno-Arribas, B. Bartolomé, Nutrients 12, 2716 (2020) [CrossRef] [PubMed] [Google Scholar]
- I. Muñoz-González, A. Jiménez-Girón, P.J. Martín-Álvarez, B. Bartolomé, M.V. Moreno-Arribas, J. Agric. Food Chem. 61, 9470–9479 (2013) [CrossRef] [PubMed] [Google Scholar]
- F. Sánchez-Patán, C. Cueva, M. Monagas, G.E. Walton, G.R. Gibson, J.E. Quintanilla-López, R. Lebrón-Aguilar, P.J. Martín-Álvarez, M.V. Moreno-Arribas, B. Bartolomé, J. Agric. Food Chem. 60, 2136–2147 (2012) [CrossRef] [PubMed] [Google Scholar]
- T. Herrera, J. Navarro del Hierro, T. Fornari, G. Reglero, D. Martin, J. Sci. Food Agric. 99, 3157–3167 (2019) [CrossRef] [PubMed] [Google Scholar]
- A. Tamargo, C. Cueva, M.D. Álvarez, B. Herranz, B. Bartolomé, M.V. Moreno-Arribas, L. Laguna, Food Hydrocolloids 77, 163–167 (2018) [CrossRef] [Google Scholar]
- D. Taladrid, D.G. de Llano, I. Zorraquín-Peña, A. Tamargo, M. Silva, N. Molinero, M.V. Moreno-Arribas, B. Bartolomé, Nutrients 13 (2021) [Google Scholar]
- B.J. Callahan, P.J. McMurdie, M.J. Rosen, A.W. Han, A.J.A. Johnson, S.P. Holmes, Nature Methods 13, 581–583 (2016) [CrossRef] [PubMed] [Google Scholar]
- B.J. Callahan, K. Sankaran, J.A. Fukuyama, P.J. McMurdie, S.P. Holmes, F1000Research 5, 1–48 (2016) [Google Scholar]
- Quast, E. Pruesse, P. Yilmaz, J. Gerken, T. Schweer, P. Yarza, J. Peplies, F.O. Glöckner, Nucleic Acids Res. 41, 590–596 (2013) [Google Scholar]
- I. Gil-Sánchez, C. Cueva, M. Sanz-Buenhombre, A. Guadarrama, M.V. Moreno-Arribas, B. Bartolomé, J. Food Comp. Anal. 68, 41–52 (2018) [CrossRef] [Google Scholar]
- I. Zorraquín-Peña, D. Taladrid, A. Tamargo, M. Silva, N. Molinero, D.G. de Llano, B. Bartolomé, M.V. Moreno-Arribas, I. Zorraquín-Peña, D. Taladrid, A. Tamargo, M. Silva, N. Molinero, D.G. de Llano, B. Bartolomé, M.V. Moreno-arribas, Microorganisms 9, 1378 (2021) [CrossRef] [PubMed] [Google Scholar]
- T. Ozdal, E. Capanoglu, F. Altay, Food Res. Int. 51, 954–970 (2013) [CrossRef] [Google Scholar]
- H. Zhang, D. Yu, J. Sun, X. Liu, L. Jiang, H. Guo, F. Ren, Nutr. Res. Rev. 27, 1–15 (2014) [CrossRef] [PubMed] [Google Scholar]
- M.S. Lingua, D.A. Wunderlin, M.V. Baroni, J. Func. Foods 44, 86–94 (2018) [CrossRef] [Google Scholar]
- L. Jakobek, Food Chem. 175, 556–567 (2015) [CrossRef] [Google Scholar]
- X. Sun, X. Cheng, J. Zhang, Y. Ju, Z. Que, X. Liao, F. Lao, Y. Fang, T. Ma, Food Res. Int. 127 (2020) [Google Scholar]
- C. Apostolidou, K. Adamopoulos, E. Lymperaki, S. Iliadis, P. Papapreponis, C. Kourtidou-Papadeli, Clinical Nutrition ESPEN 10, e224–e233 (2015) [CrossRef] [PubMed] [Google Scholar]
- G. Chiva-Blanch, M. Urpi-Sarda, E. Ros, P. Valderas-Martinez, R. Casas, S. Arranz, M. Guillén, R.M. Lamuela-Raventós, R. Llorach, C. Andres-Lacueva, R. Estruch, Clin. Nutr. 32, 200–206 (2013) [CrossRef] [Google Scholar]
- D.W. Droste, C. Iliescu, M. Vaillant, M. Gantenbein, N. De Bremaeker, C. Lieunard, T. Velez, M. Meyer, T. Guth, A. Kuemmerle, G. Gilson, A. Chioti, Nutr. J. 12, 1–9 (2013) [CrossRef] [Google Scholar]
- J.P. Rifler, F. Lorcerie, P. Durand, D. Delmas, K. Ragot, E. Limagne, F. Mazué, J.M. Riedinger, P. D’Athis, B. Hudelot, M. Prost, G. Lizard, N. Latruffe, Mol. Nutr. Food Res. 56, 345–351 (2012) [CrossRef] [PubMed] [Google Scholar]
- M. Taborsky, P. Ostadal, T. Adam, O. Moravec, V. Glodger, A. Schee, T. Skala, Bratislava Med. J. 118, 292–298 (2017) [CrossRef] [Google Scholar]
- R.A. Kemperman, G. Gross, S. Mondot, S. Possemiers, M. Marzorati, T. Van de Wiele, J. Doré, E.E. Vaughan, Food Res. Int. 53, 659–669 (2013) [CrossRef] [Google Scholar]
- I. Belda, C. Cueva, A. Tamargo, C.N. Ravarani, A. Acedo, B. Bartolomé, M.V. Moreno-Arribas, Food Func. 12, 4152–4164 (2021) [CrossRef] [PubMed] [Google Scholar]
- C. Cueva, F. Sánchez-Patán, M. Monagas, G.E. Walton, G.R. Gibson, P.J. Martín-Álvarez, B. Bartolomé, M.V. Moreno-Arribas, FEMS Microb. Ecol. 83, 792–805 (2013) [CrossRef] [Google Scholar]
- P. Dolara, C. Luceri, C. De Filippo, A.P. Femia, L. Giovannelli, G. Caderni, C. Cecchini, S. Silvi, C. Orpianesi, A. Cresci, Mutation Research - Fundamental and Molecular Mechanisms of Mutagenesis 591, 237–246 (2005) [CrossRef] [Google Scholar]
- M.I. Queipo-Ortuño, M. Boto-Ordóñez, M. Murri, J.M. Gomez-Zumaquero, M. Clemente-Postigo, R. Estruch, F. Cardona Diaz, C. Andrés-Lacueva, F.J. Tinahones, Am. J. Clin. Nutr. 95, 1323–1334 (2012) [CrossRef] [Google Scholar]
- G. Ma, Y. Chen, J. Func. Foods 66, 103829 (2020) [CrossRef] [Google Scholar]
- E. Barroso, I. Muñoz-González, E. Jiménez, B. Bartolomé, M.V. Moreno-Arribas, C. Peláez, M. del Carmen Martínez-Cuesta, T. Requena, Mol. Nutr. Food Res. 61, 1–9 (2017) [CrossRef] [Google Scholar]
- C.I. Le Roy, P.M. Wells, J. Si, J. Raes, J.T. Bell, T.D. Spector, Gastroenterology 158, 270–272. e2 (2020) [CrossRef] [PubMed] [Google Scholar]
- A. Esteban-Fernández, C. Ibañez, C. Simó, B. Bartolomé, M.V. Moreno-Arribas, J. Proteome Res. 17, 1624–1635 (2018) [CrossRef] [PubMed] [Google Scholar]
- A. Esteban-Fernández, C. Ibañez, C. Simó, B. Bartolomé, M.V. Moreno-Arribas, Oeno One 54, 455–467 (2020) [CrossRef] [Google Scholar]
All Tables
Viability percentages of HCT-116 and HT-29 cells after exposure to colonic fermentation content at the start point (0 hour) and end point (48 hours) of colonic-stage simulations (mean values ± standard deviation). Columns indicating 10%, 25%, 50% and 75% present the dilutions of the colonic media used for each cell viability assay. Lower-case letters denote statistically significant differences between food models within exposition time (4 or 24 hours) and dilution.
All Figures
|
Figure 1 Glucose diffusion through dialysis membranes Glucose and Wine+Glucose food models at the endpoint of small intestinal digestion. Data are expressed as mean ± standard deviation of bioaccessible glucose calculated as described on Eq. (1). Lowercase letters denote significant differences between food models at the same dialysis time. |
| In the text | |
|
Figure 2 Phenolic compounds in the food matrix models (Wine+Glucose and Wine+Protein) at the gastric and small intestine stages. Data are expressed as % increment of wine phenolic compounds for each food model respect to the Wine food model. |
| In the text | |
|
Figure 3 Phenolic compound bioaccessibility from the food matrix models (Wine+Glucose and Wine+Protein) at the small intestine stage. Data are expressed as % increment of wine phenolic compounds for each food model respect to the Wine food model. |
| In the text | |
|
Figure 4 Concentration (mg/L of wine present in the food model) of main phenolic compounds in the food model (a) and after intestinal digestion (b) for the Wine and Wine+Lipid food models. Data are expressed in mean values ± standard deviation. |
| In the text | |
|
Figure 5 Bioaccessibility (%) of free fatty acids, monoglycerides and cholesterol (a) and bioaccessibility of bile salts (b) for the Wine+Lipid and Lipid food models. Data are expressed in mean values ± standard deviation. |
| In the text | |
|
Figure 6 Relative abundance at phylum level for the different food models during colonic fermentations. Data are expressed in mean values ± standard deviation. Graphs show the taxa with a relative abundance > 0.5%. |
| In the text | |
Current usage metrics show cumulative count of Article Views (full-text article views including HTML views, PDF and ePub downloads, according to the available data) and Abstracts Views on Vision4Press platform.
Data correspond to usage on the plateform after 2015. The current usage metrics is available 48-96 hours after online publication and is updated daily on week days.
Initial download of the metrics may take a while.