Open Access
Figure 2
Download original image
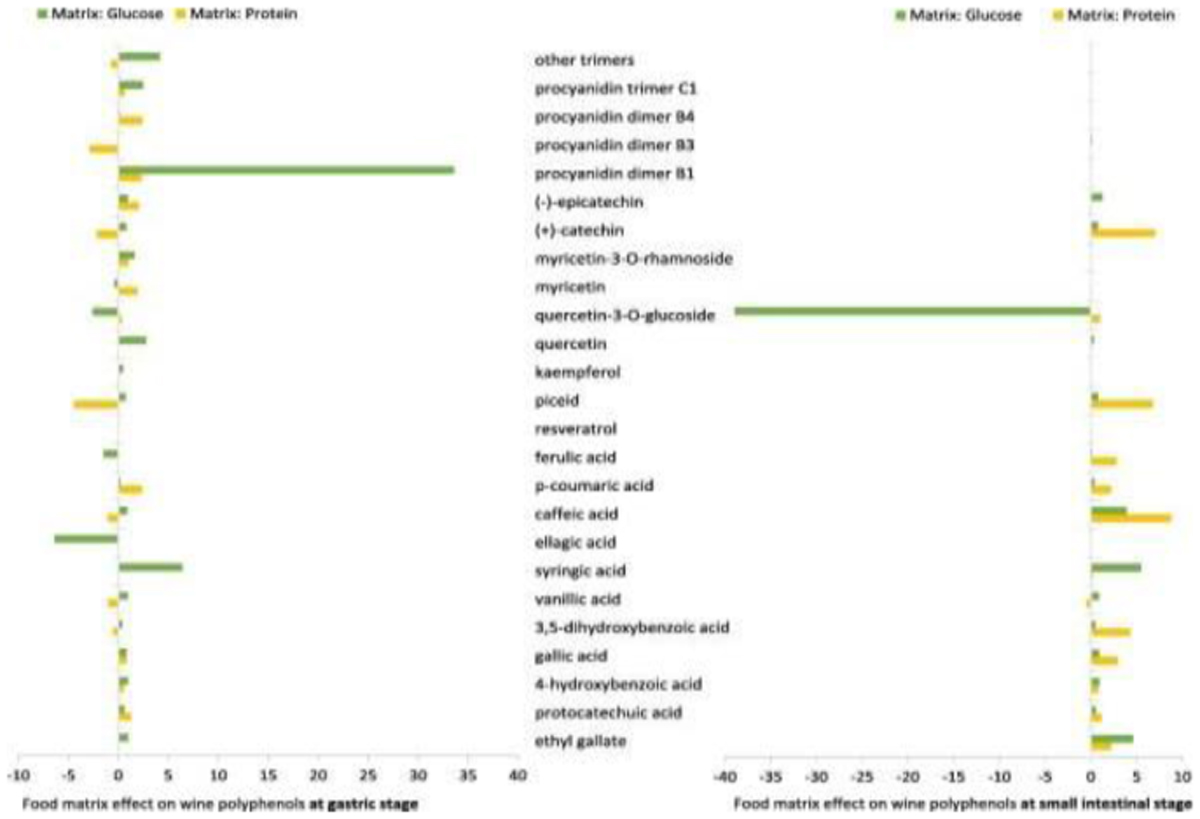
Phenolic compounds in the food matrix models (Wine+Glucose and Wine+Protein) at the gastric and small intestine stages. Data are expressed as % increment of wine phenolic compounds for each food model respect to the Wine food model.
Current usage metrics show cumulative count of Article Views (full-text article views including HTML views, PDF and ePub downloads, according to the available data) and Abstracts Views on Vision4Press platform.
Data correspond to usage on the plateform after 2015. The current usage metrics is available 48-96 hours after online publication and is updated daily on week days.
Initial download of the metrics may take a while.