Figure 1
Download original image
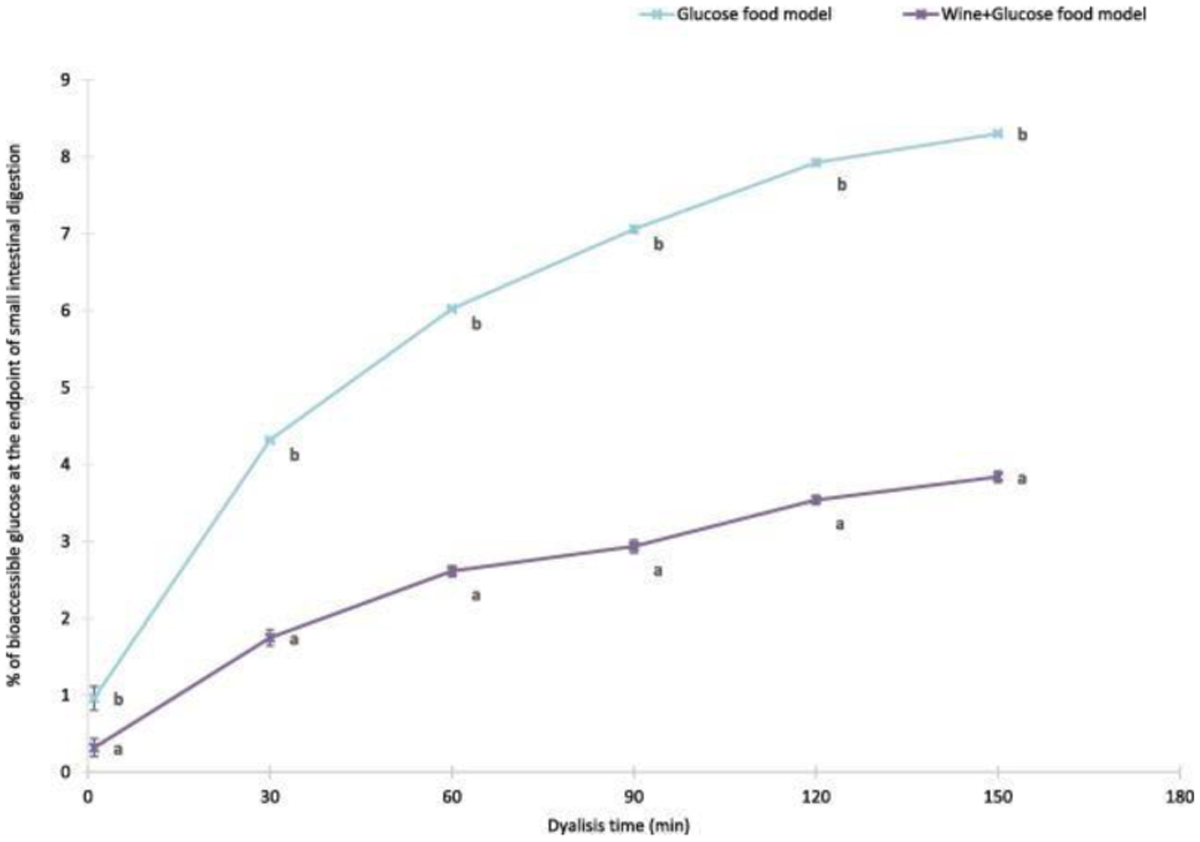
Glucose diffusion through dialysis membranes Glucose and Wine+Glucose food models at the endpoint of small intestinal digestion. Data are expressed as mean ± standard deviation of bioaccessible glucose calculated as described on Eq. (1). Lowercase letters denote significant differences between food models at the same dialysis time.
Current usage metrics show cumulative count of Article Views (full-text article views including HTML views, PDF and ePub downloads, according to the available data) and Abstracts Views on Vision4Press platform.
Data correspond to usage on the plateform after 2015. The current usage metrics is available 48-96 hours after online publication and is updated daily on week days.
Initial download of the metrics may take a while.