Open Access
Figura 6
Download original image
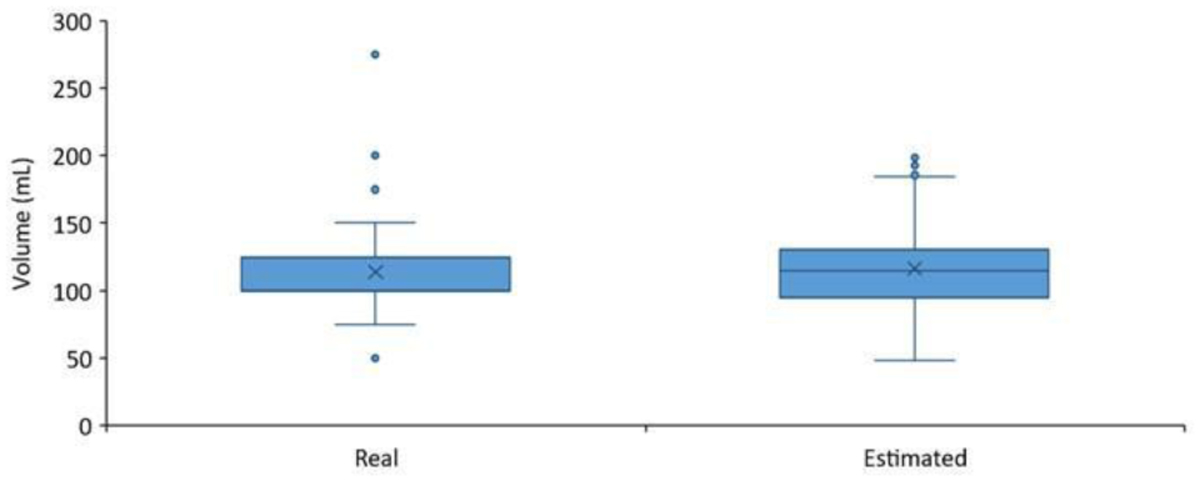
Box-plot del volumen de vino tinto en un servicio (copa/vaso) (n=229) comparando los valores reales, medidos directamente por el participante utilizando el vaso graduado, y los valores estimados por nuestro modelo DL a partir de las fotografías tomadas por los participantes.
Current usage metrics show cumulative count of Article Views (full-text article views including HTML views, PDF and ePub downloads, according to the available data) and Abstracts Views on Vision4Press platform.
Data correspond to usage on the plateform after 2015. The current usage metrics is available 48-96 hours after online publication and is updated daily on week days.
Initial download of the metrics may take a while.