Figure 3.
Download original image
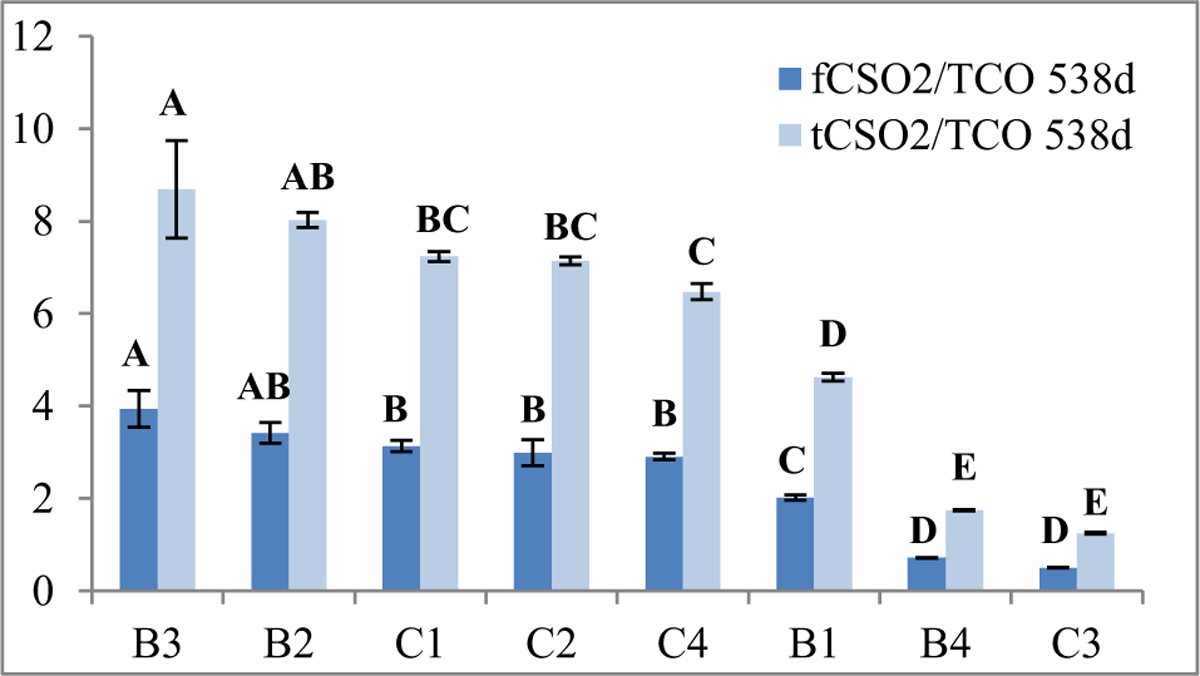
Ratios of free/total Consumed SO2 / TCO at 538 days. Stoppers B1 to B4; screw caps C1 to C4. f(t)CSO2/TCO: free (total) Consumed SO2 / Total Consumed Oxygen. fCSO2, tCSO2 and TCO expressed in mg/L. Ratios ranked in descending order of fCSO2/TCO 538 d. Different labels (A, B, C, D, E) indicate means that significantly differ at p<0.0001. Averages and standard deviations are based on 3 bottles per procedure.
Current usage metrics show cumulative count of Article Views (full-text article views including HTML views, PDF and ePub downloads, according to the available data) and Abstracts Views on Vision4Press platform.
Data correspond to usage on the plateform after 2015. The current usage metrics is available 48-96 hours after online publication and is updated daily on week days.
Initial download of the metrics may take a while.