Open Access
Figura 2
Download original image
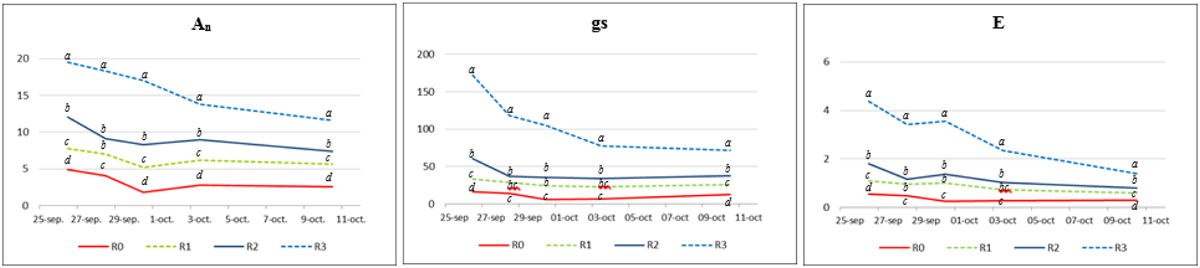
Fotosíntesis (An, µmol CO2.m-2.s-1), Conductancia estomática (gs, mmol H2O.m-2.s-1) y Transpiración (E, mmol H2O.m-2.s-1) a las 12 hora solar en septiembre-octubre de 2016, de los tratamientos (Trat.): R0, R1, R2 y R3. Significación estadística: p<0,05 (letras distintas indican diferencia significativa entre tratamientos).
Current usage metrics show cumulative count of Article Views (full-text article views including HTML views, PDF and ePub downloads, according to the available data) and Abstracts Views on Vision4Press platform.
Data correspond to usage on the plateform after 2015. The current usage metrics is available 48-96 hours after online publication and is updated daily on week days.
Initial download of the metrics may take a while.